How has Canadian venture fared over the past decade through the lens of capital exited? An analysis by RBCx sheds light on challenges and successes the venture ecosystem has faced, and learnings for the years ahead.
Key Points:
- Too much liquidity may never be considered a bad thing, but too much unpredictable liquidity has proven to strain our VC ecosystem. With more than 50 per cent of our past decade’s exit value coming in 2020 and 2021 alone, fund cycles for general partners (GPs) were pulled forward as record waves of limited partner (LP) capital needed to get re-deployed. Now, 2023 and 2024 represent some of the lowest levels of capital allocated to Canadian venture over the past decade.
- Over the past decade, 85 per cent of Canada’s aggregate exit value was generated from only 27 per cent of all exits, the Top 50 largest. With so much value generated from that small subset, achieving Top 50-sized exit outcomes remains critical for VC investors who aspire to build a lasting franchise in Canadian venture.
- Be aware of the misconception that comes from correlating exit success with size. Rather, by reviewing total capital raised relative to exit value, also known as exit capital efficiency, Canadian exits can be evaluated based on the underlying profitability to their shareholders, and not simply by size.
- Though on a smaller scale, Canada has grown its exit value and volume faster than the US market over the past decade. As the US VC market remains 30x larger and more mature than that of Canada, witnessing strong exit trends at this point in Canada’s development is a healthy sign.
- Managing the cumulative exit value to fundraised ratio is key for Canada to continue building a capital efficient VC ecosystem. As investors anticipate exit activity picking back up in the coming years, the ability to continue to shrink the ratio gap that exists between Canada and the US remains vital.
Just how healthy is Canada’s venture ecosystem? An exclusive RBCx analysis spotlighting Canadian venture over the past decade helps answer this question from the “other” side of the venture equation—capital exited—rather than the more frequently discussed capital invested. John Rikhtegar, Director, RBCx Capital and the study’s lead author, presented our findings at the 2024 Banff Venture Forum this October. Here, we share his key takeaways.
Since the launch of the federal government’s Venture Capital Action Plan in 2013, Canadian venture has proactively grown and matured. We now have a decade’s worth of data to dig deep into Canadian venture capital (VC) backed exit value and liquidity. The picture that emerges is a developing ecosystem that has much to celebrate, and continue building on, over the decade ahead. However, while growth is projected, realizing our highest potential is never guaranteed. With this in mind, our analysis uncovered several key insights to help inform how the ecosystem should evolve to maximize growth in Canada and on the global stage.
How market cycles influence venture
It’s been a long held assumption that venture capital performance is highly correlated to where we are in the market cycle. Our review of the past decade confirms this is true for both Canada and the US. Over the past decade (January 2013 – August 2024), Canadian venture exited 184 companies, who collectively generated $56.5 billion in exit value (our methodology is below.)
Exit values increased as interest rates dropped
As the graph below indicates, from 2016 to 2021, aggregate exit value increased annually as interest rates fell and investors moved further out on their risk curves before peaking in 2021. Approximately 50 per cent of Canada’s aggregate exit value from the entire decade was generated in just two years, 2020 and 2021. This was not a phenomenon unique to Canada as the US market data shows an identical surge in those years.
As inflation ran rampant and both public and private markets experienced a sharp decline, Canada’s exit environment significantly weakened leading to the single worst year-over-year decline in exit value from 2021 to 2022.

The rise and fall of Canada’s exit volume
The prior market cycle also influenced Canada’s exit volume. The graph below shows Canada’s annual volume of VC-backed exits in relation to the Bank of Canada’s Policy interest rate. In 2008, interest rates dropped to near zero for the first time ever, to rescue the economy from the world financial crisis and subsequently kept rates low for another 13 years, providing the longest economic recovery on record. This allowed acquirers greater access to capital at a lower cost which helped drive valuations up, resulting in more pricing alignment between buyers and sellers, and more deals being completed.
Compared to the interest rates of the 80s, 90s and 2000s, this extended period of low interest rates is clearly unique. With the rapid rise in rates in 2022, exit volume decreased in turn. While the economy has, essentially, regained its pre-2008 posture, the venture ecosystem feels as illiquid as ever in this relatively unfamiliar territory.
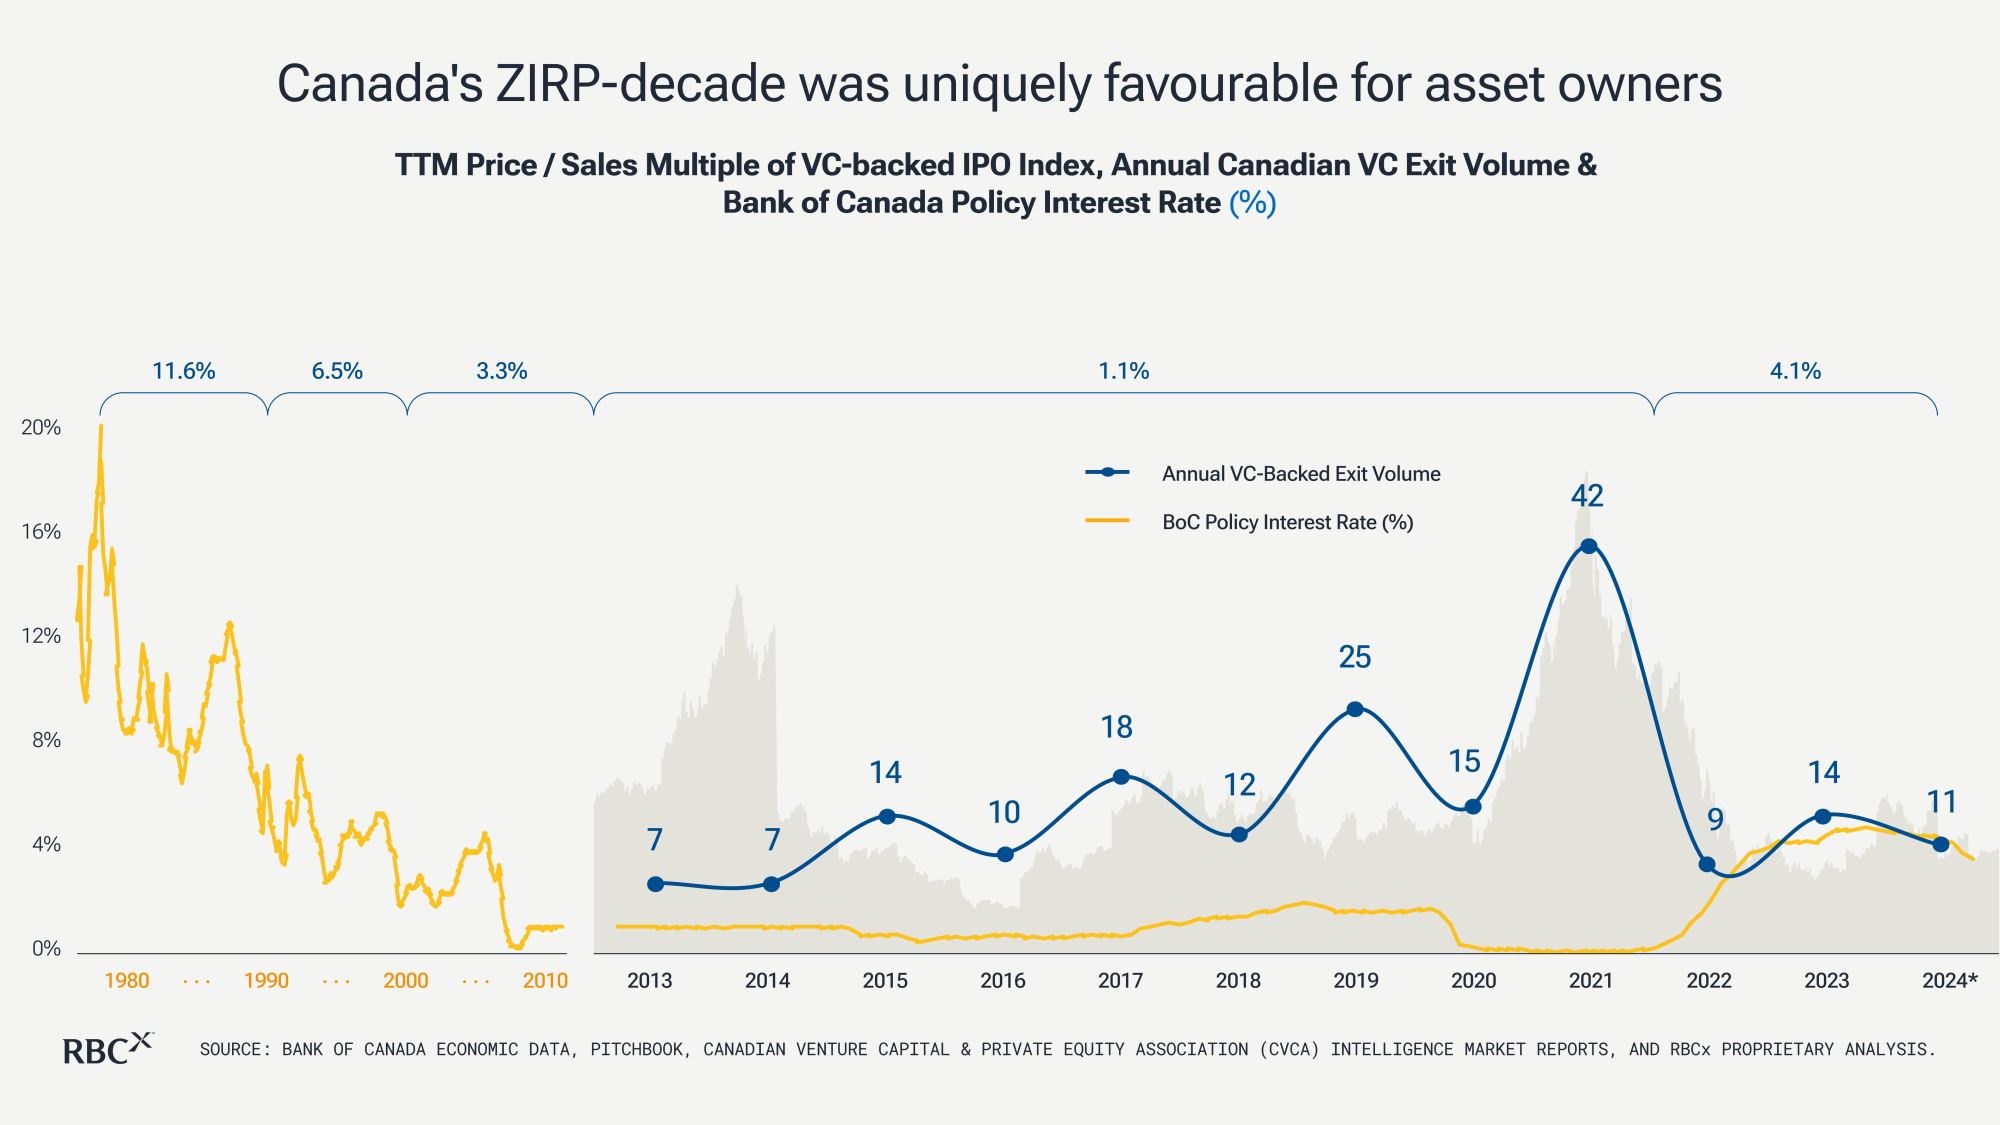
Canada’s ZIRP-decade was uniquely favourable for asset owners, including VC-backed companies, which drove an increasing number of exits from 2013 – 2021.
How the market cycle plays out across all capital vectors
Looking at exit value and volume from the past decade only gives a partial picture of how market cycles influence Canadian venture. As a result, RBCx also analyzed its impact on all three capital vectors:
- Capital exited
- Capital fundraised by GPs from LPs, and
- Capital invested by GPs / VCs into companies
The three graphs below illustrate how the cycle played out across each capital vector, starting with a gradual risk-on investing period, followed by a peak liquidity window, and culminating by a sharp risk-off decline, as follows:
Canadian VC Capital exited
When 50 per cent of the past decade’s exit value was generated in 2020 and 2021, fund cycles for GPs were pulled forward as LPs amassed capital that needed to be deployed into the markets.
Canadian VC fundraised
GPs drew up expansive fund strategies, raised larger sized funds, and deployed them quickly. As the middle graph illustrates, record exit years of 2020 and 2021 were followed by record fundraising years in 2021 and 2022 when $14 billion was raised from LPs by GPs and allocated to Canadian venture (representing 40 per cent of the past decade’s aggregate capital allocated). Capital, however, is not unlimited, and with so much of it pulled forward in a short period, a steep drop in fundraising naturally followed in 2023 and 2024.
Canadian VC invested
In 2021 and 2022, $25 billion in VC capital was invested into Canadian companies (graph on right). What remains unknown, however, is how much of the $14 billion raised in 2021 and 2022 by GPs is still available as dry powder today to support the huge cohort of companies that raised in 2021 and 2022, as well as to continue investing in new startups?
What’s abundantly clear is the market cycle over the course of the past decade significantly impacted all three vectors in Canadian venture.
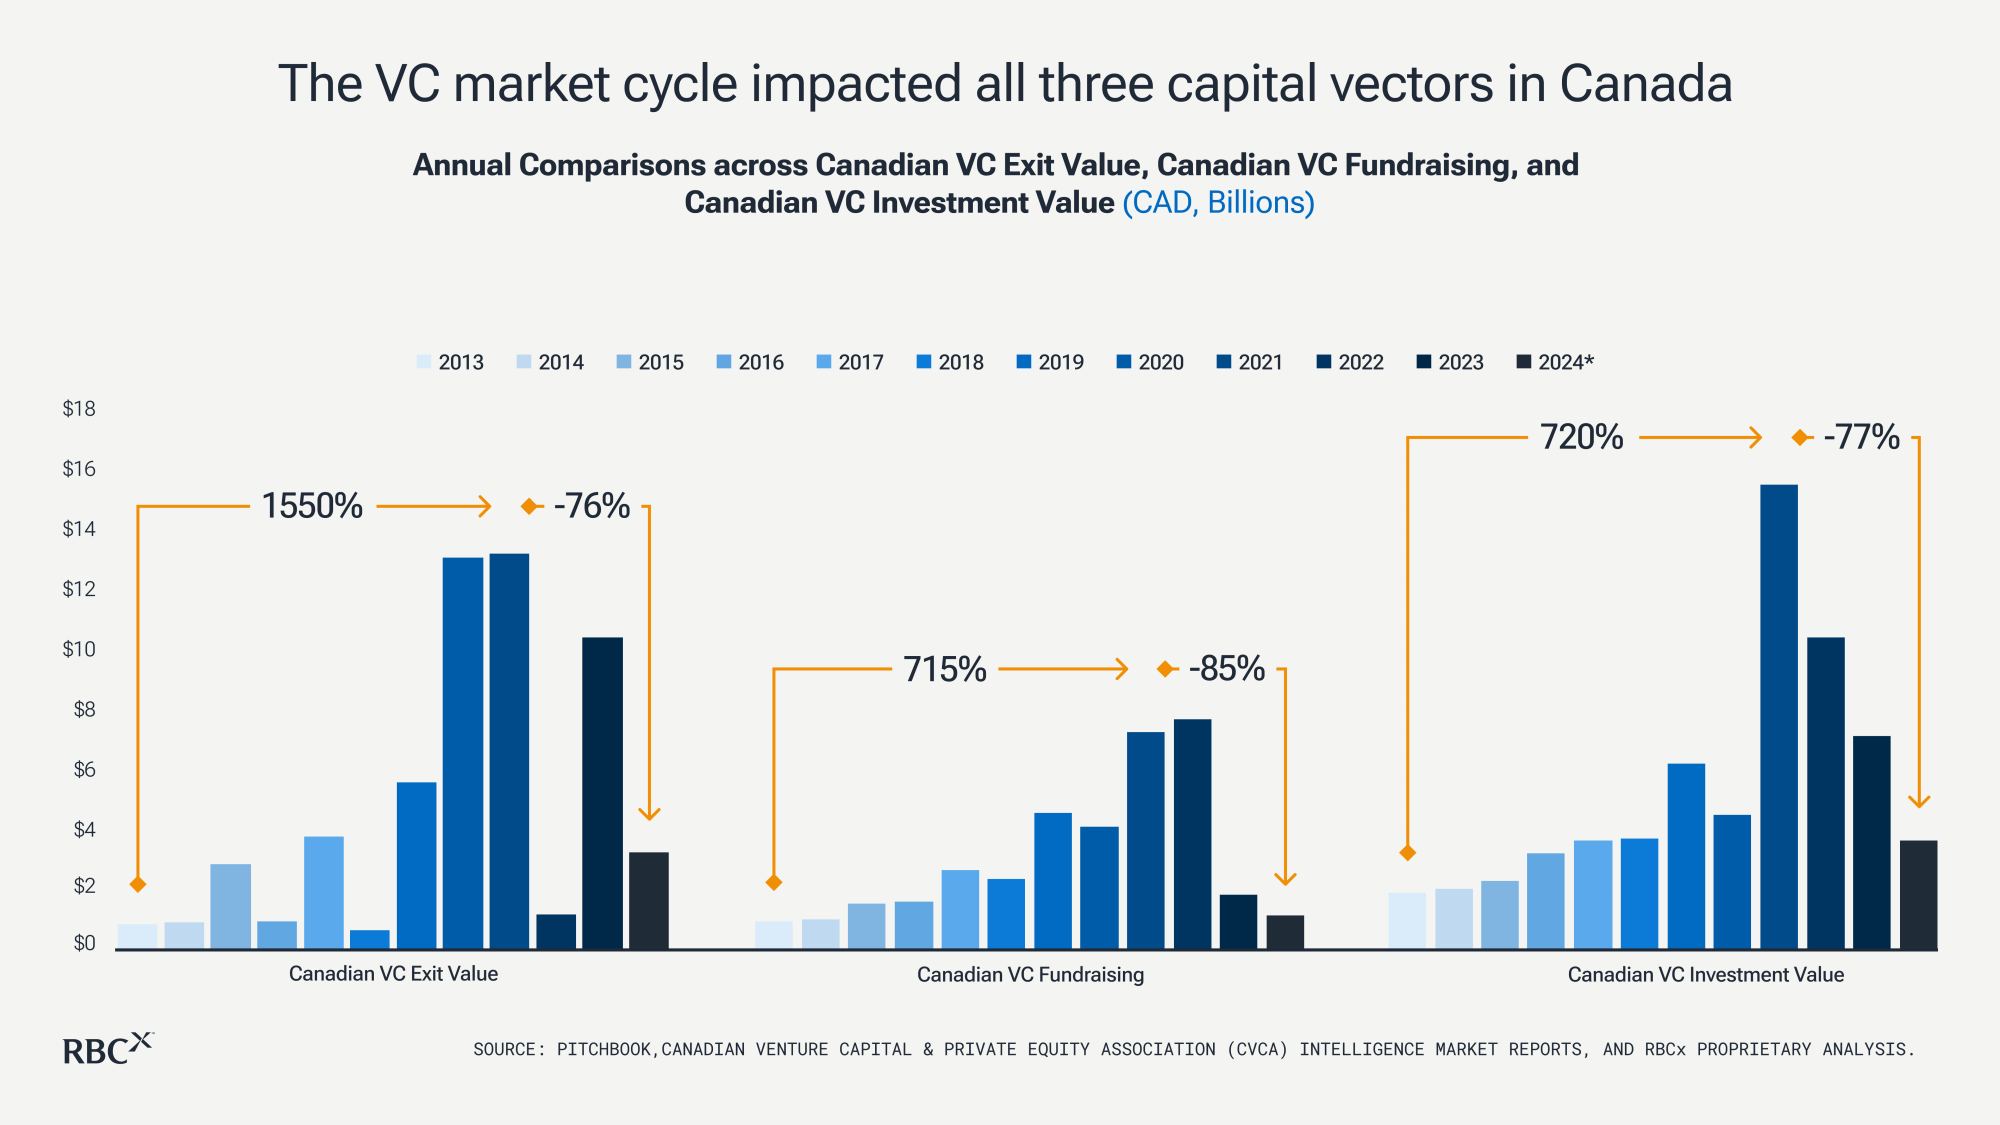
Our prior decade’s VC market cycle has impacted all three capital vectors within Canadian VC, across capital exited, allocated, and invested.
The prevalence of power law in Canadian VC
If the concentration of exit value shown in the above section isn’t already a strong enough argument for the presence of power law in Canadian venture, here’s even more evidence.
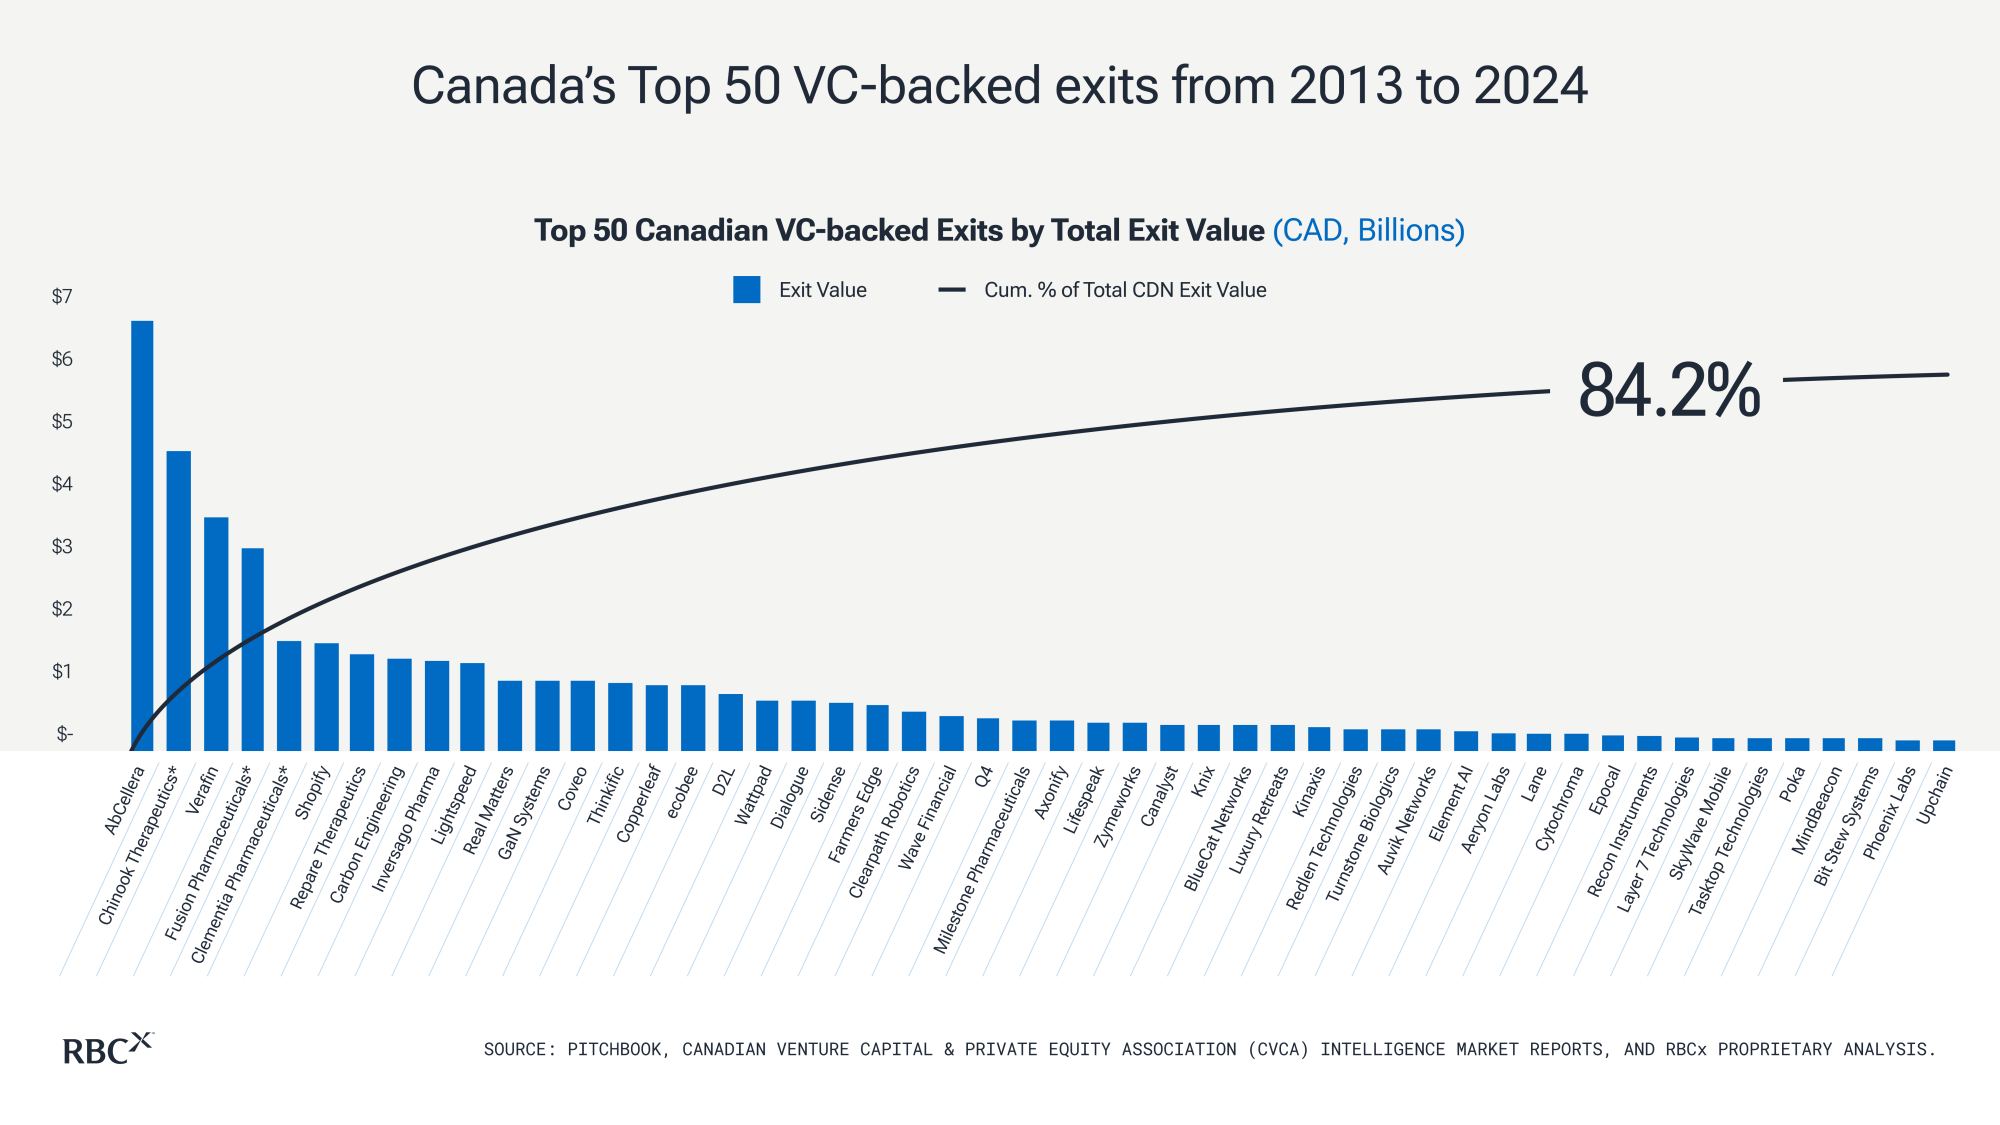
Out of Canada’s 184 total exits over the past decade, the top 50 largest exits (“Top 50”) alone produced a startling 84 per cent of total exit value despite making up only 27 per cent of the exit volume.
In fact, the median exit value of Canada’s Top 50 exits is $467 million versus $93 million for all exits from the past decade. That’s five times greater than the median exit value for all 184 exits.
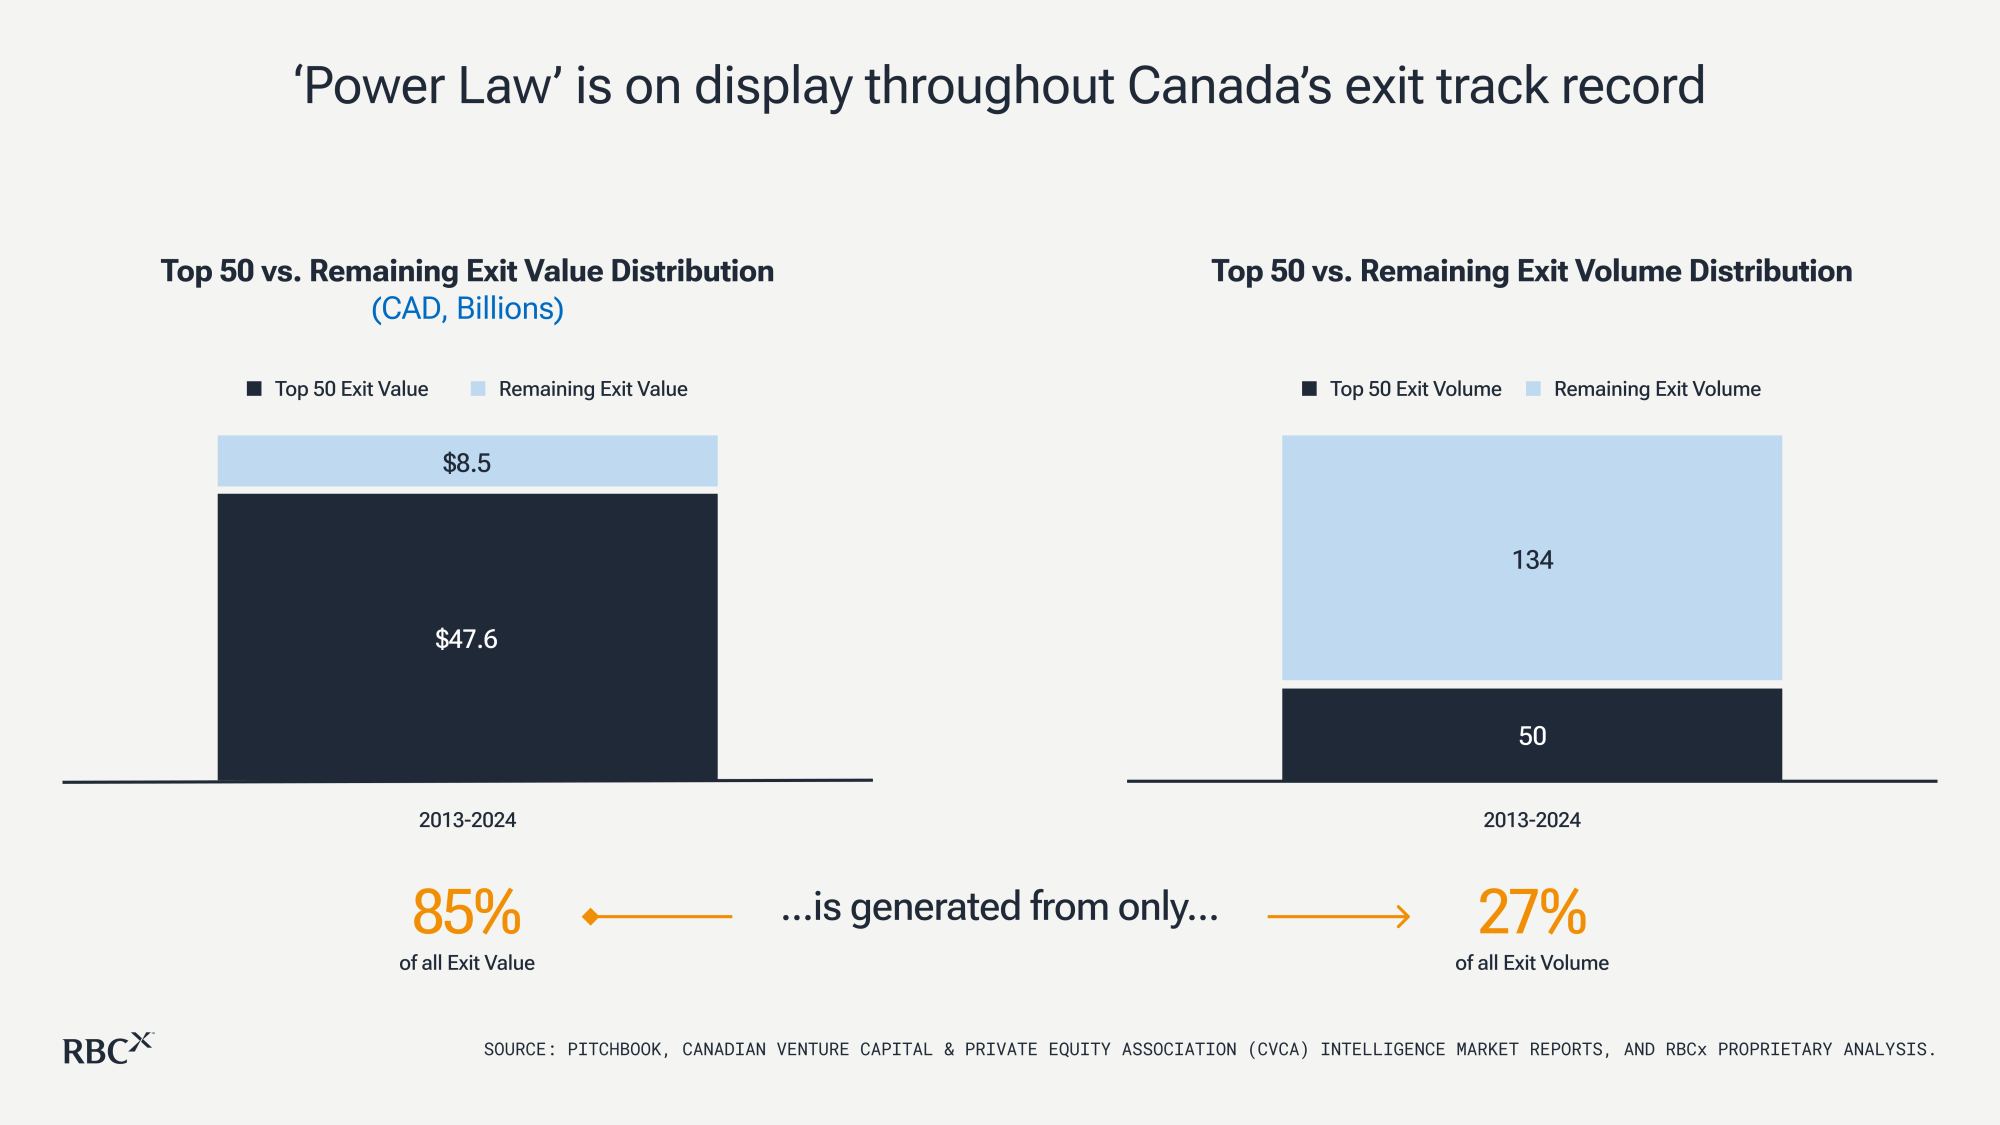
Venture capital’s defining ‘Power Law’ characteristic is on clear display throughout Canada’s exit track record.
Unless Canadian GPs and their LPs secure exit values in the Top 50 range, they may find it challenging to generate strong investor returns and raise subsequent funds. For example: Using Canada’s aggregate median exit value of $93 million and the Top 50 median exit value of $467 million, a GP that owns 10% at exit in both scenarios would produce $9.3 million and $46.7 million in proceeds, respectively. For a given fund size, those proceeds will produce significantly different fund-level returns.
Unpacking Canada’s Top 50 VC-backed exits
Canada’s Top 50 exits over the past decade truly stand out from the pack. That’s why it’s important to understand their underlying characteristics. So, who made the Top 50? The data set includes companies that exited for a value over $186 million, generated from one of three ways: an Initial Public Offering (“IPO”), a merger or acquisition (“M&A”), or a majority buyout.
For companies that completed an IPO, RBCx utilized the IPO valuation as the exit value in our analysis for an ‘apples-to-apples’ comparison. However, it remains important to note that we view an IPO event as a financing event leading towards a liquidity event and not a pure-play liquidity event in and of itself, given lock-up restrictions and other factors that lead to investors not being able to exit their position at that IPO price. Additionally, for companies that went public but got acquired post-IPO, the post-public acquisition price determined the exit value for the purposes of this analysis.
A healthy balance between M&A and IPO exits
When we examined how these Top 50 exited, M&A was the favoured exit path, generating 52 per cent of the Top 50 exit value and 54 per cent of exit volume. IPOs came a close second, indicating a healthy balance between acquisitions and IPOs. This is a healthy sign that demonstrates how Canada’s largest exits are not reliant on one single exit path, and that our ecosystem remains less vulnerable to being adversely affected should any one path be shut off. Conversely, with 40 of the US’s Top 50 exits being generated from an IPO, the follow-on consequences of a primarily risk-off IPO landscape since 2022 have placed significant liquidity pressures in their ecosystem since then.
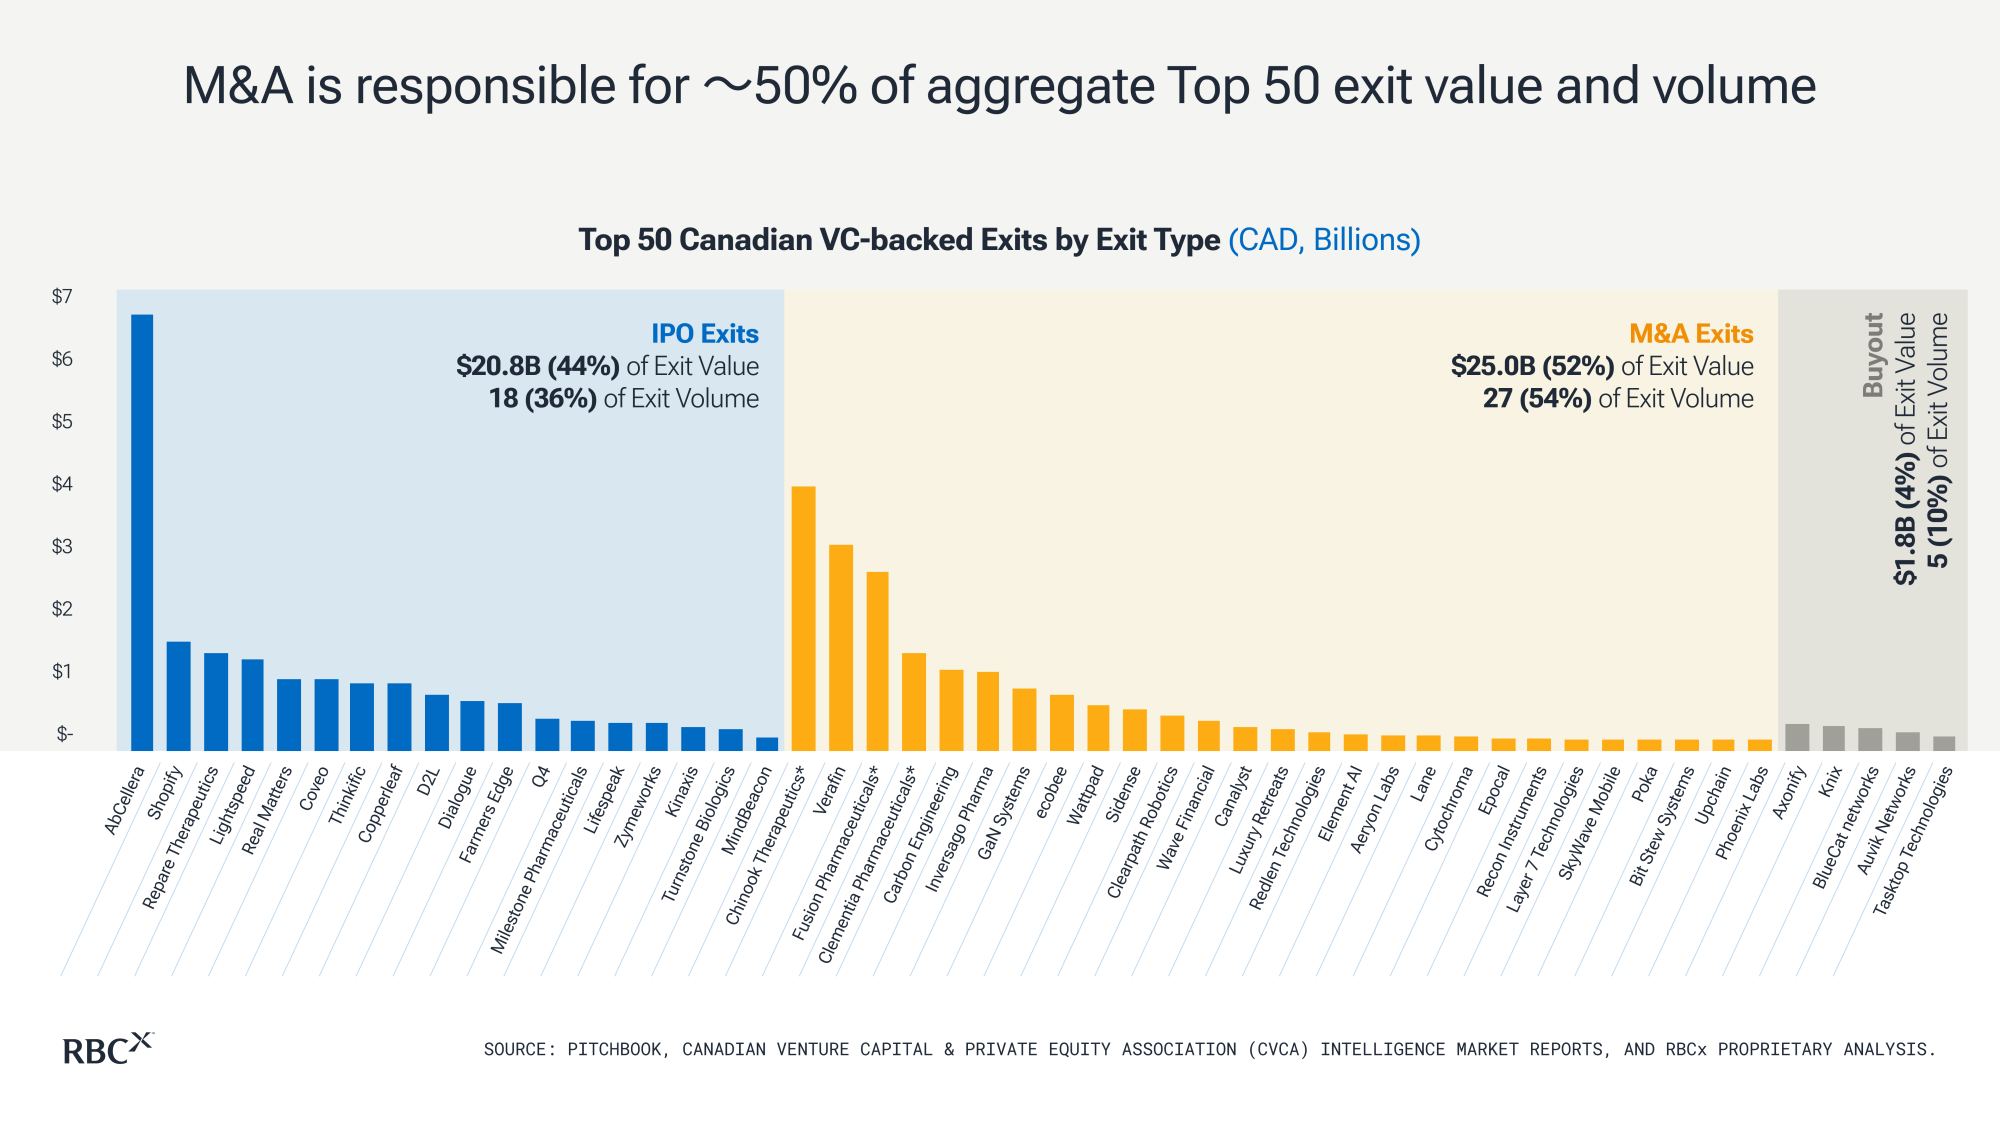
Canada strikes a healthy balance across exit types, with M&A being responsible for 〜50% of aggregate Top 50 exit value and volume.
Life sciences produced some of Canada’s largest exits
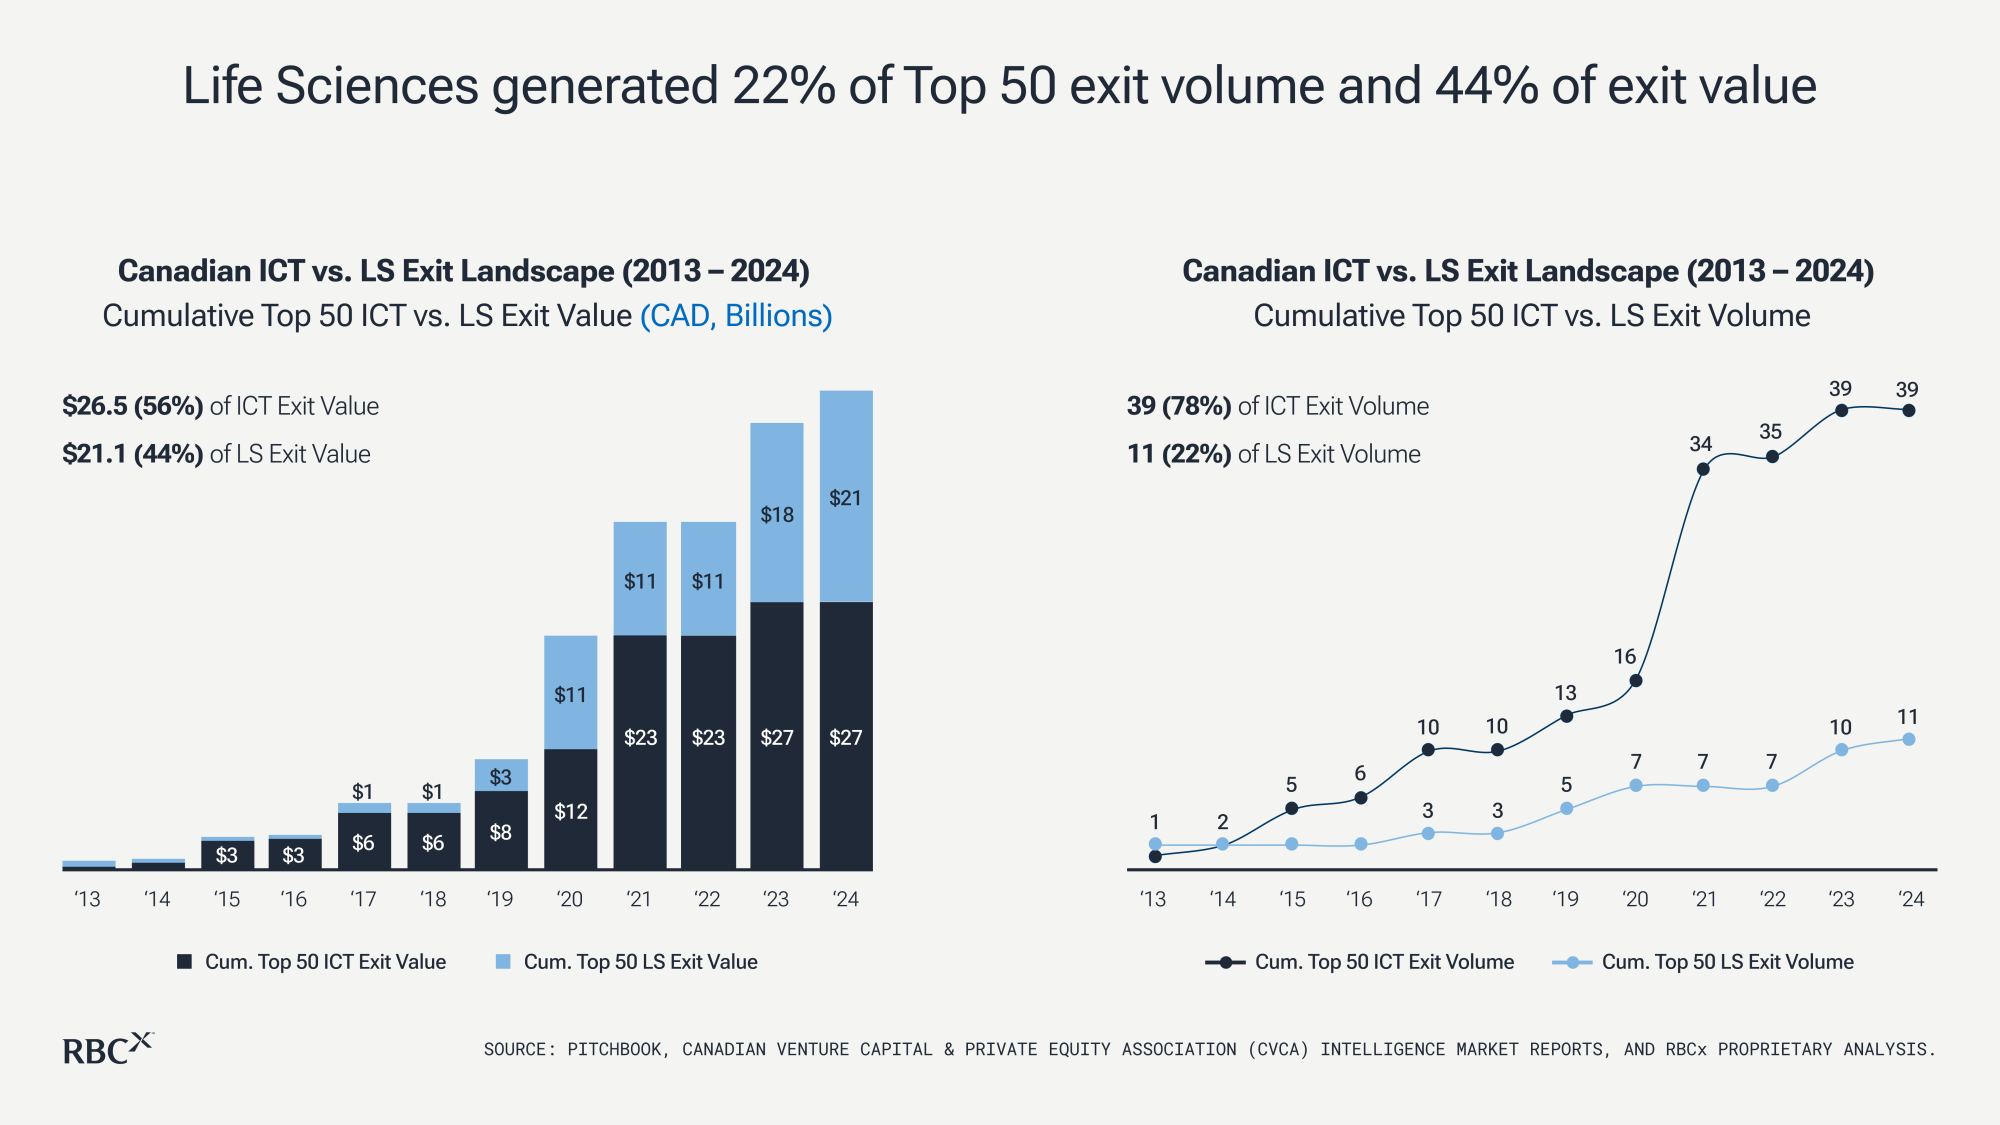
The two prominent sectors that leverage venture capital in Canada are information and communication technology (ICT) and life sciences. We compared how the two sectors fared, and discovered Canadian life sciences companies performed especially well over the past decade. Specifically, although life sciences was responsible for only 11 of Canada’s Top 50, they made up 44% of the aggregate exit value and produced four of the top five VC-backed exits in Canadian venture over the past decade. These exits were AbCellera, Chinook Therapeutics, Fusion Pharmaceuticals, and Clementia Pharmaceuticals.
Interestingly, an RBCx analysis on capital allocated to Canadian venture over the past decade reveals only seven per cent of all capital allocated went to life science funds. This finding, when paired with our exit data above, suggests a compelling opportunity to invest in this sector, purely based on supply and demand dynamics.
A long term approach to investing in venture
Investors consider venture capital as one of the longest held and most illiquid asset classes. The time required for an early stage startup to grow into a mature enterprise is significant, especially when the market prioritizes capital efficient growth and not ‘growth at all costs’. To help quantify just how long-dated venture capital has been over the past decade, we analyzed the Top 50 using two metrics: exit age and first financing exit age.
Exit age
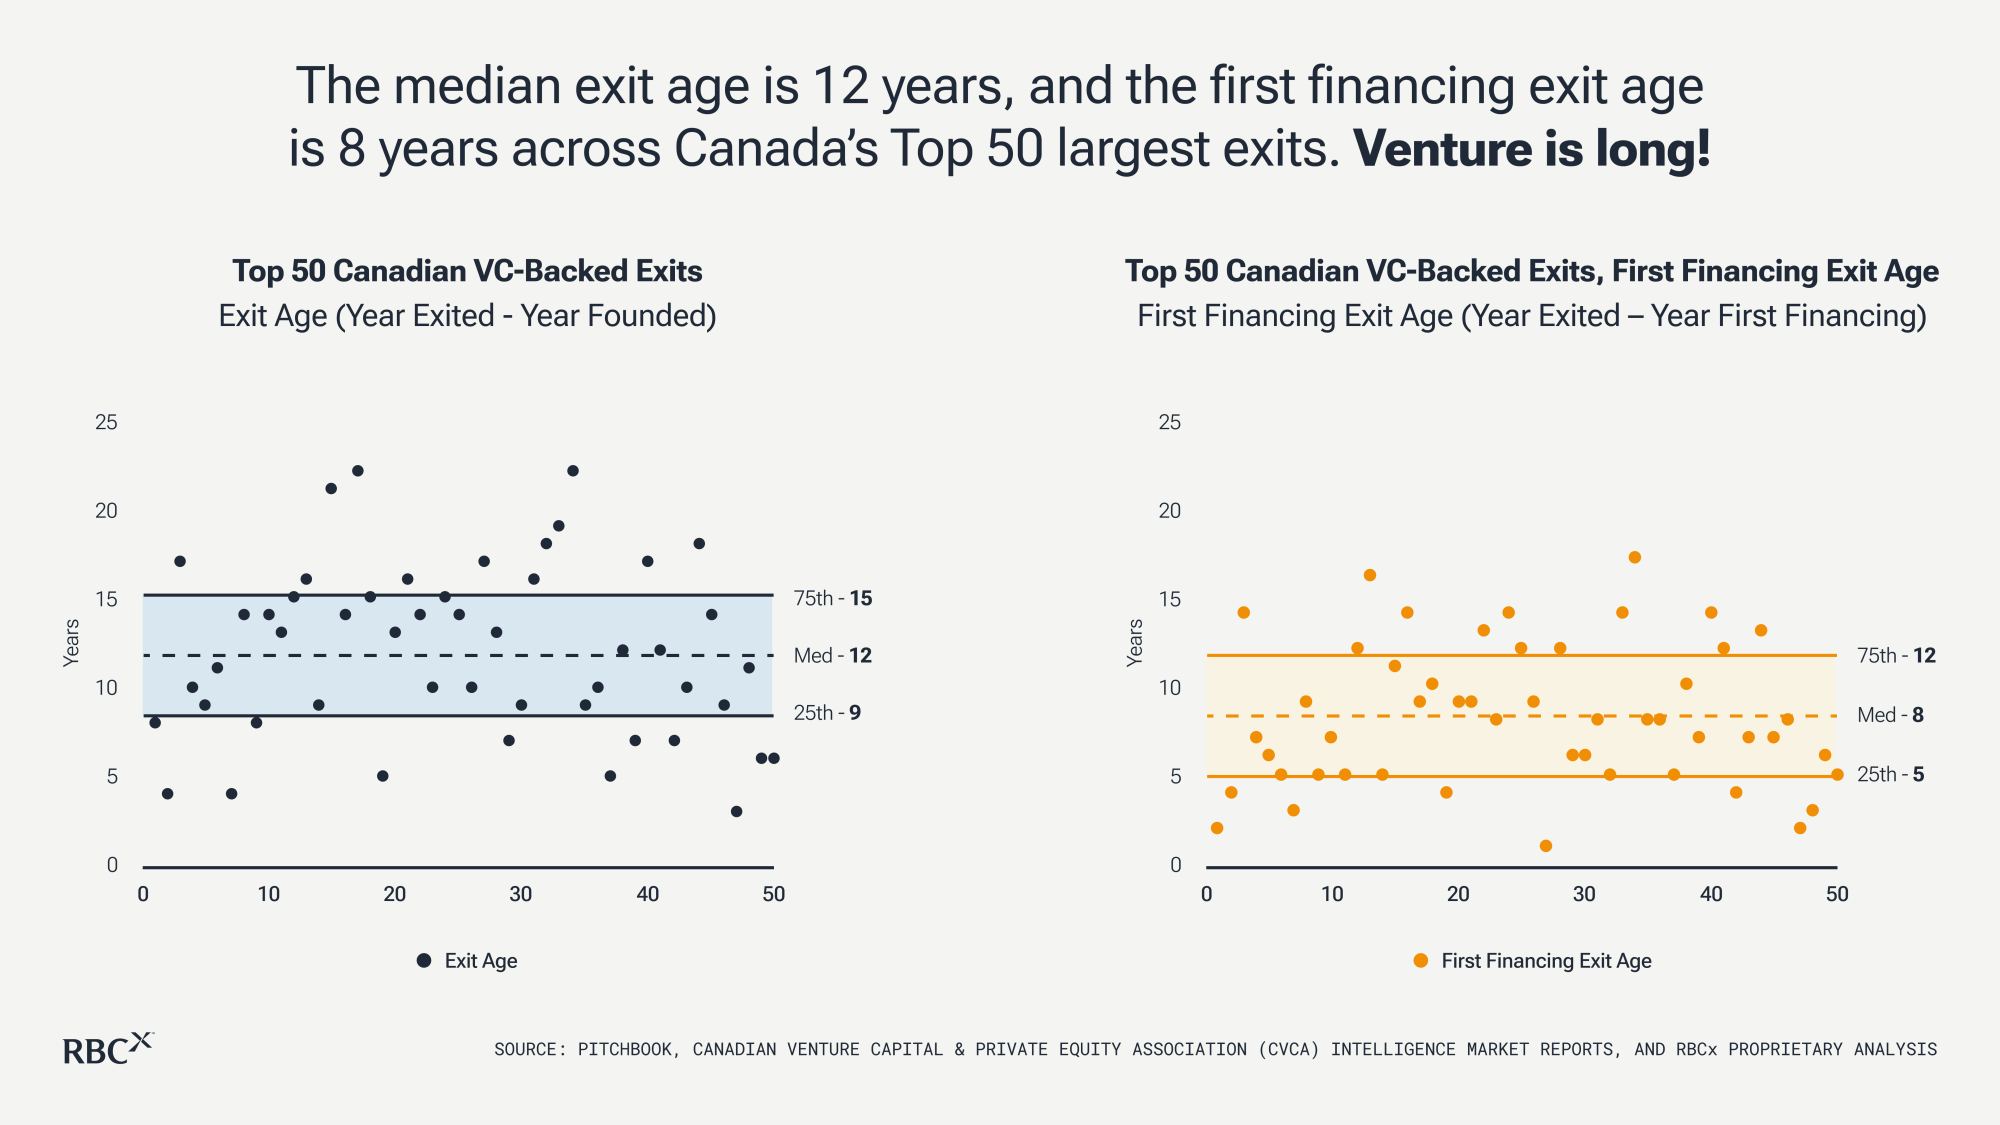
A company’s exit age refers to the number of years a company operated prior to exit, calculated as the year exited minus the year founded. This is relevant to founders because it measures their typical illiquidity––specifically, the time between when they founded the business to when it exits. On median, founders of Canada’s Top 50 take 12 years to build, scale, and exit their companies.
First financing exit age
The first financing exit age is especially important to early-stage investors and allocators as it represents the number of years between a company’s first round of venture funding and when it exits. The median first financing exit age of Canada’s Top 50 is eight years.
Potential implication to GPs and LPs
GPs typically invest in companies where they see a path to returning capital within 10 years based on the traditional fund structure to invest, follow-on, and return capital to their LPs. Yet the median first financing exit age for Canada’s Top 50 is eight years. So, early stage investors who participated in one of these startups’ first VC round of financing would have held their positions unrealized for eight years, should they have not sold prematurely in the secondary market. Keep in mind, if a fund invests in a company after its second year (which is common considering most initial investment periods are during the first four years of a fund), that would mean it is already extending itself beyond the 10-year term.
The key is for investors to approach venture capital with a long-term investment horizon and to align their funds with market cycles. The largest exits in Canada have typically taken the longest to produce. This helps explain why some of the most prolific funds in the past decade only became so after year eight because that’s when their best assets had their major liquidity events.
The misconception of correlating exit ‘success’ with ‘size’
The largest exits tend to get the most attention among venture capital investors, allocators, and founders––many of whom subscribe to the conventional belief that the bigger the exit size, the more successful the company’s outcome. However, assessing the success of a company’s outcome exclusively by the size of its exit value can be misleading.
For example:
If two companies exit—one for $100 million and the other for $1 billion—most investors would likely prefer to have invested in the latter. But what if the company with the smaller exit only raised $10 million to achieve a $100 million exit, whereas the other company raised $500 million to achieve the $1 billion exit?
The result? The aggregate investor return would have been five times more profitable in the smaller company exit. This is due to capital efficiency.
In our analysis, capital efficiency is calculated by dividing exit value by total equity capital raised, where total equity capital raised includes only primary equity capital and excludes all forms of debt and secondary capital. The higher the capital efficiency on exit, the higher the net returns for all shareholders.
Total equity capital raised by Canada’s Top 50
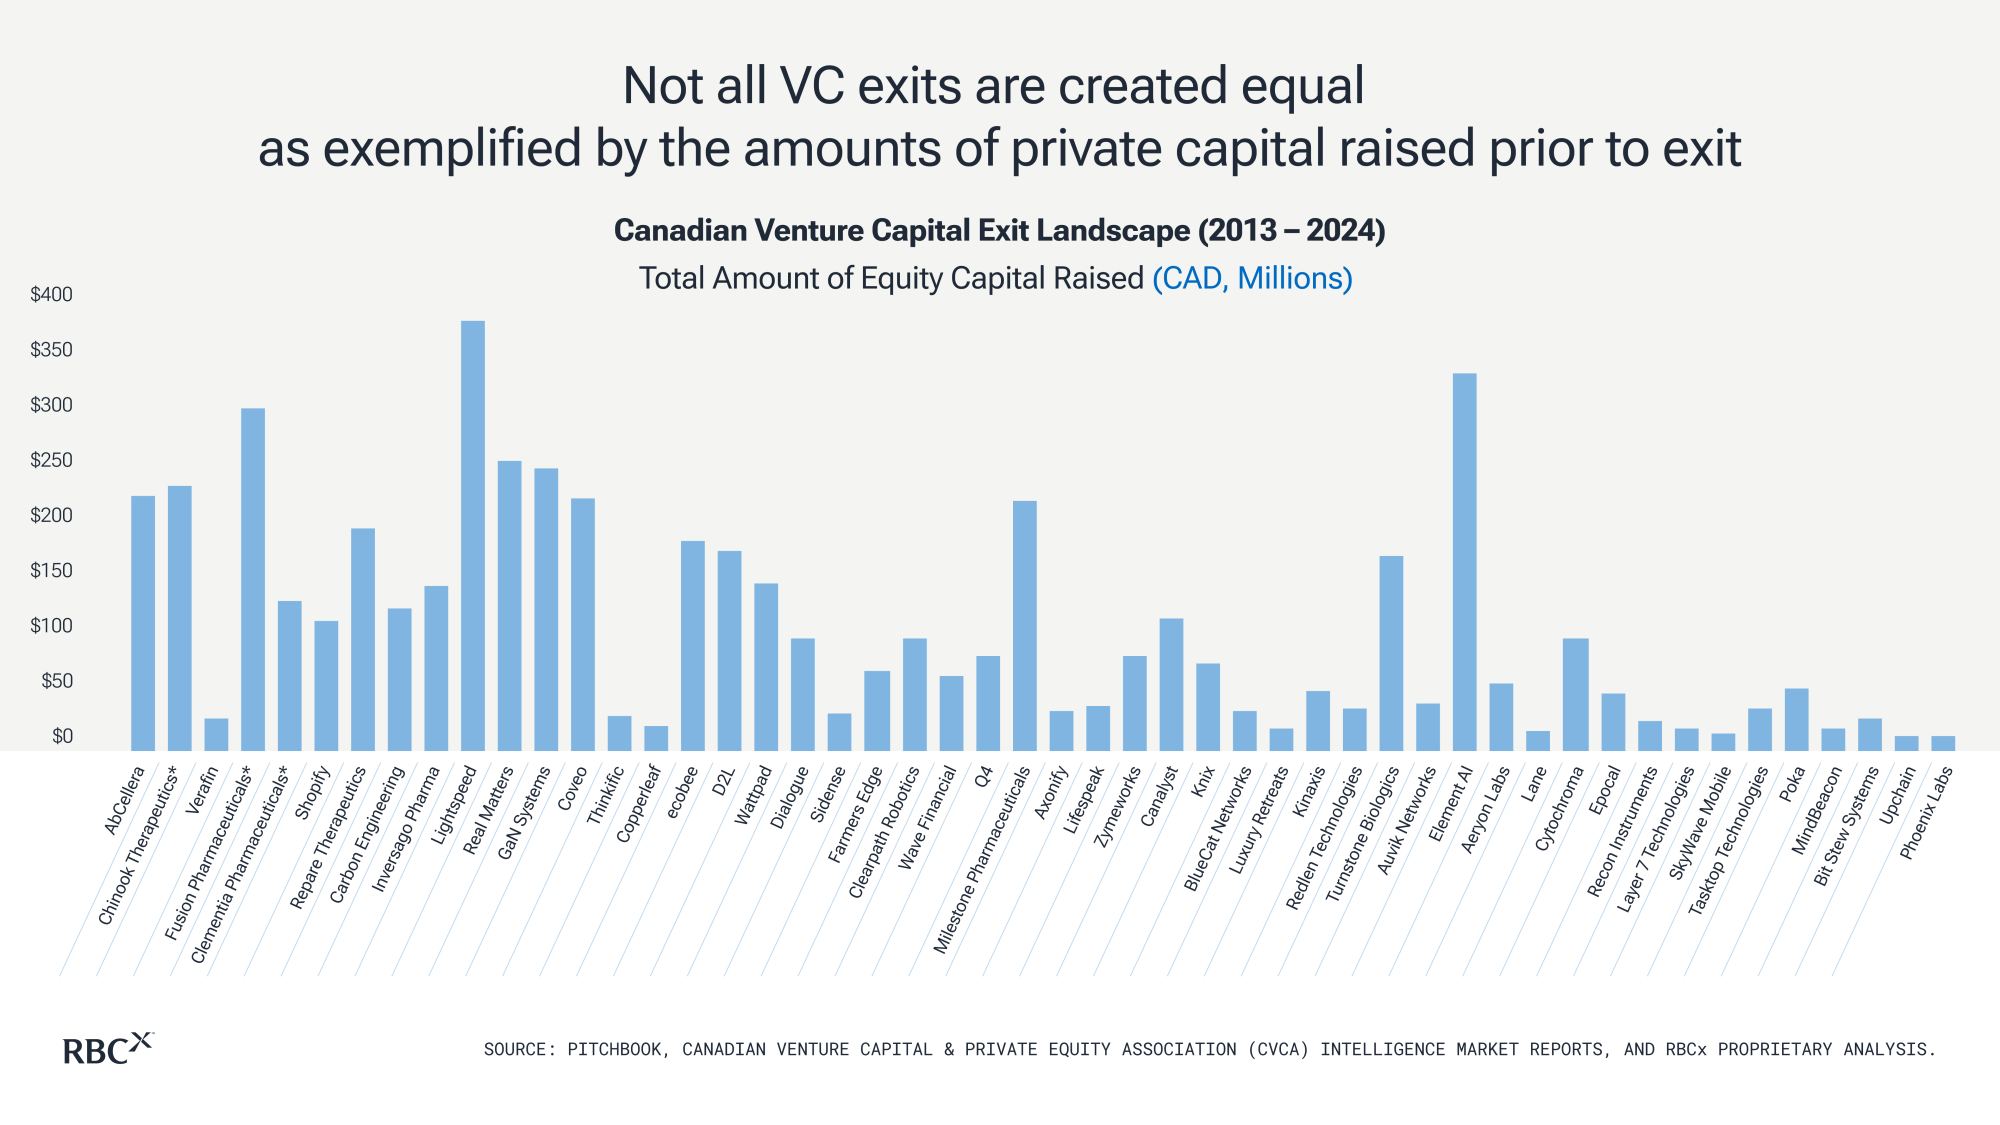
When we apply this to Canada’s Top 50, it’s quite illuminating. Below is a graph representing the Top 50 exits in their original order from largest to smallest size, but now showcasing the amount of total equity capital raised by each company. Note the significant dispersion across the Top 50. Though the top quartile of exits seem to have raised more capital (higher bars) and the lower quartile seem to have raised less capital (lower bars), it’s clear that organizing the Top 50 based on total equity capital raised would have a very different order. This exemplifies why not all exits are created equal.
Total equity capital as a percentage of exit value
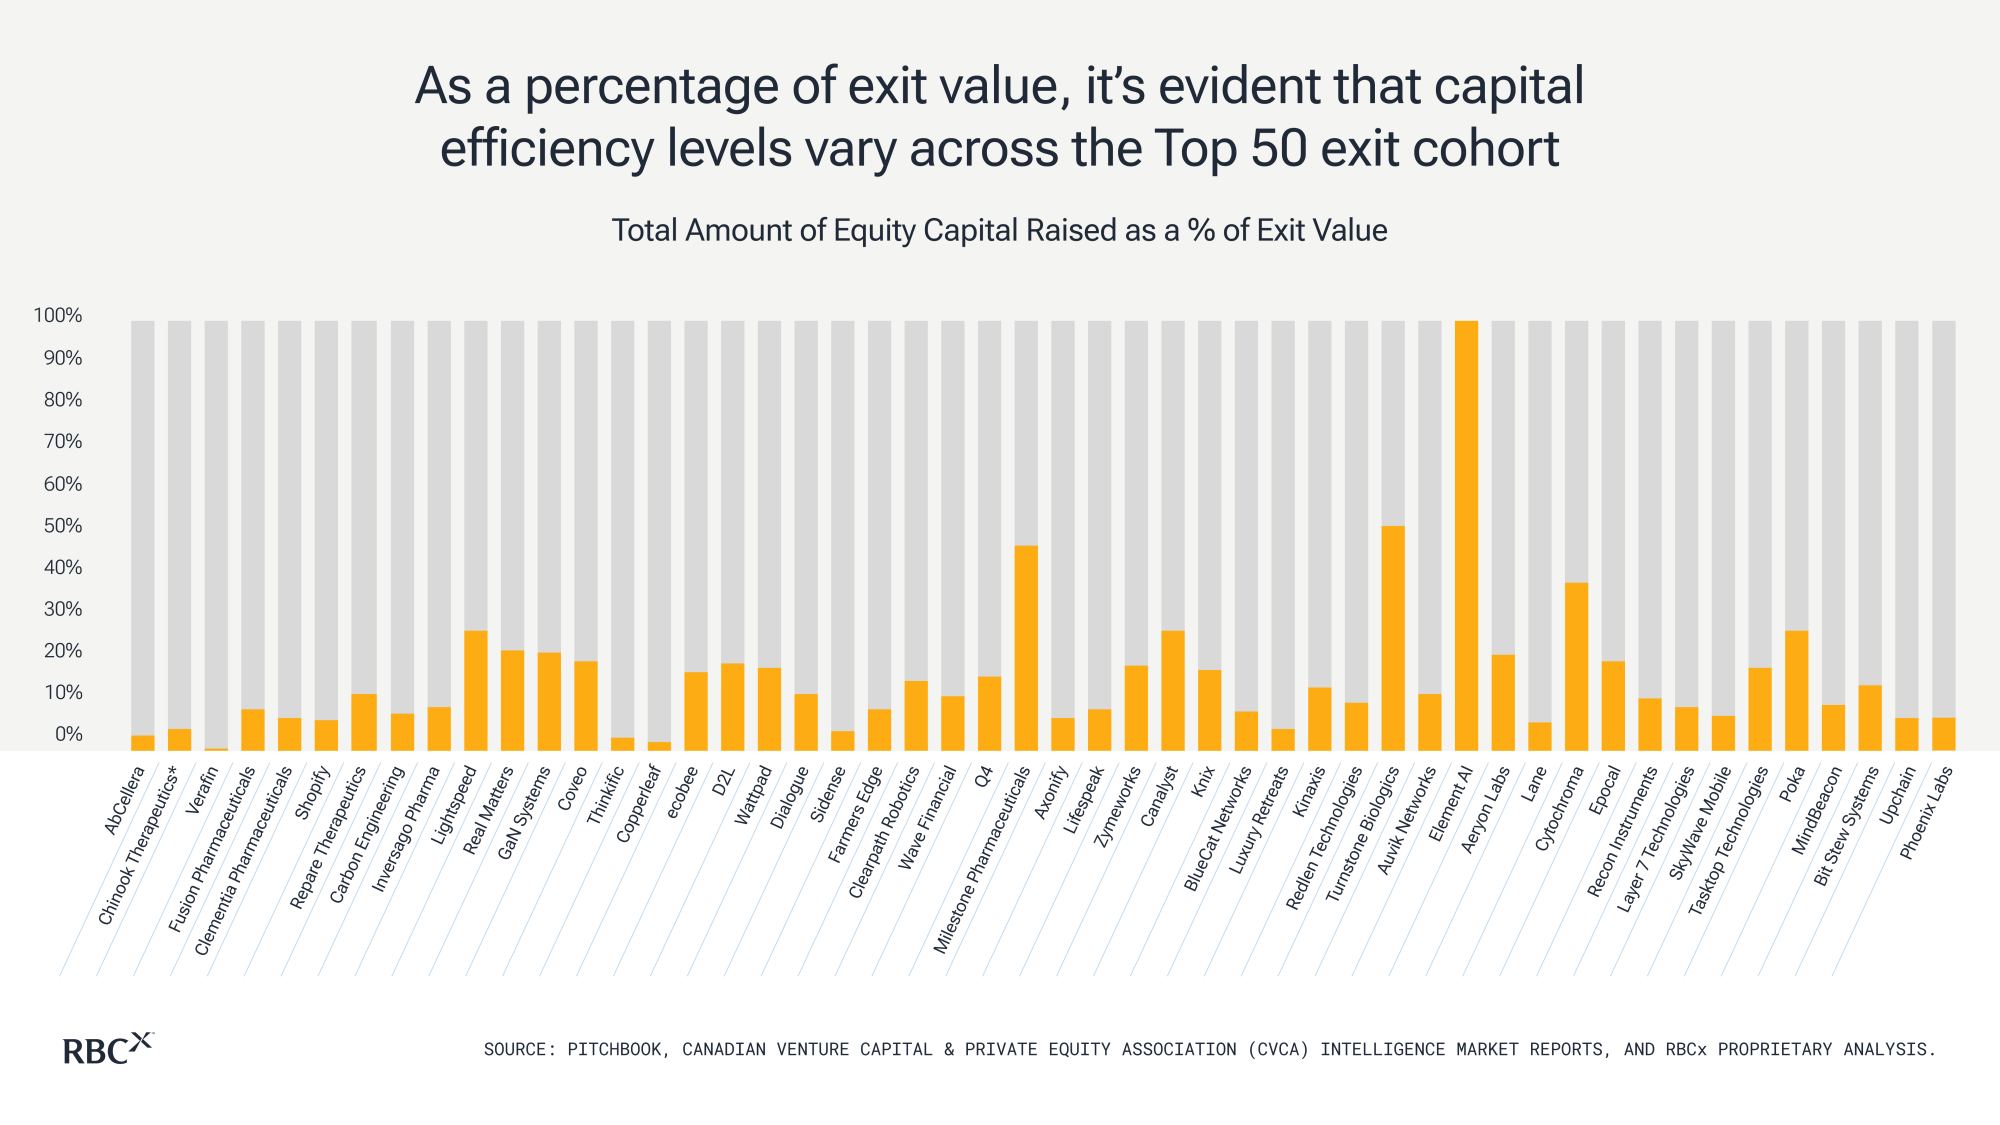
Looking at total equity capital in isolation doesn’t tell us the whole story. We need to look at the amounts raised relative to the amount each company exited for. In the graph below, we assess the total amount of equity capital raised as a percentage of exit value, instead of in absolute dollars. The higher bars represent companies that raised a larger percentage of equity capital relative to their exit value, which leads to a potentially less efficient exit for shareholders. Conversely, the lower bars represent companies who raised a smaller percentage of equity capital relative to their exit value, leading to a potentially more efficient exit for shareholders. Through this lens, there is, again, significant variability across the Top 50.
Measuring profitability with exit capital efficiency
The narrative changes quite dramatically for Canada’s Top 50 exits when we measure by the profitability of each exit. For this, we introduced a new metric called Exit Capital Efficiency. This is calculated by dividing the total exit value by the total equity capital raised. This metric measures exit success by exit profitability, rather than exit size. More specifically, since exit capital efficiency is a measure of profitability, it allows us to analyze which company exits were the most lucrative through the lens of their underlying shareholders: the GPs and their LPs.
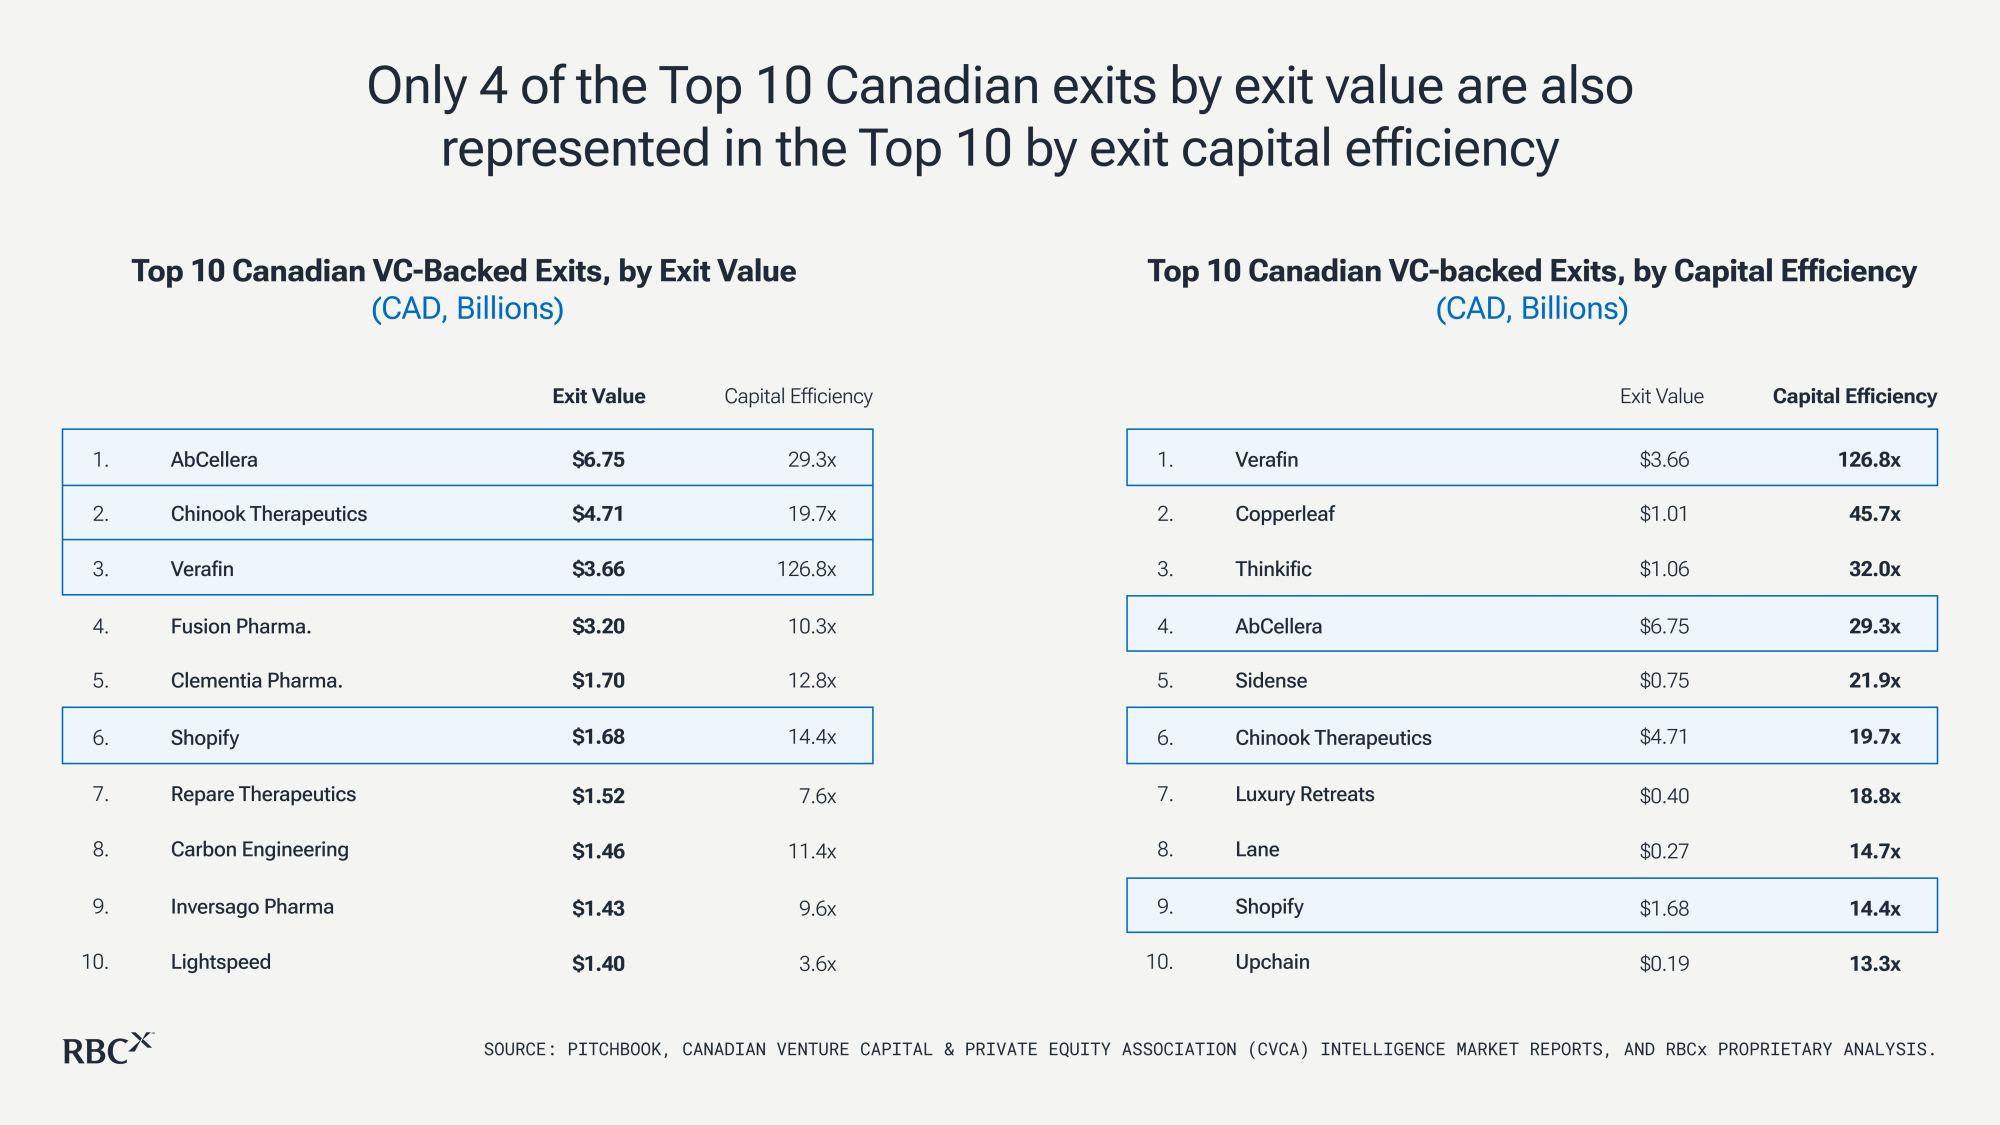
As the graph below shows, though Verafin represents the third largest exit in Canadian venture over the past decade, it is even more remarkable to compare its exit capital efficiency across Canada’s Top 50, having exited for an amount 127x greater than the total equity capital invested into it. Interestingly, the median amount Canada’s Top 50 exited for was 7.7x greater than the total equity capital raised in the business.

High exit value and capital efficiency can optimize exit outcomes
A deeper look at these metrics indicates only four of the top 10 Canadian exits by exit value are also among the top 10 by exit capital efficiency. These are AbCellera, Chinook Therapeutics, Verafin, and Shopify. Herein lies the danger in equating exit size with success. The data clearly shows that larger exits do not always equate to more profitable exits. Being mindful of both exit value and capital efficiency has the potential to optimize exit outcomes for all shareholders. Companies that exit at high values while remaining capital efficient will help ensure our ecosystem succeeds and thrives in the coming decade.
How Canada’s exit track record stacks up to the US
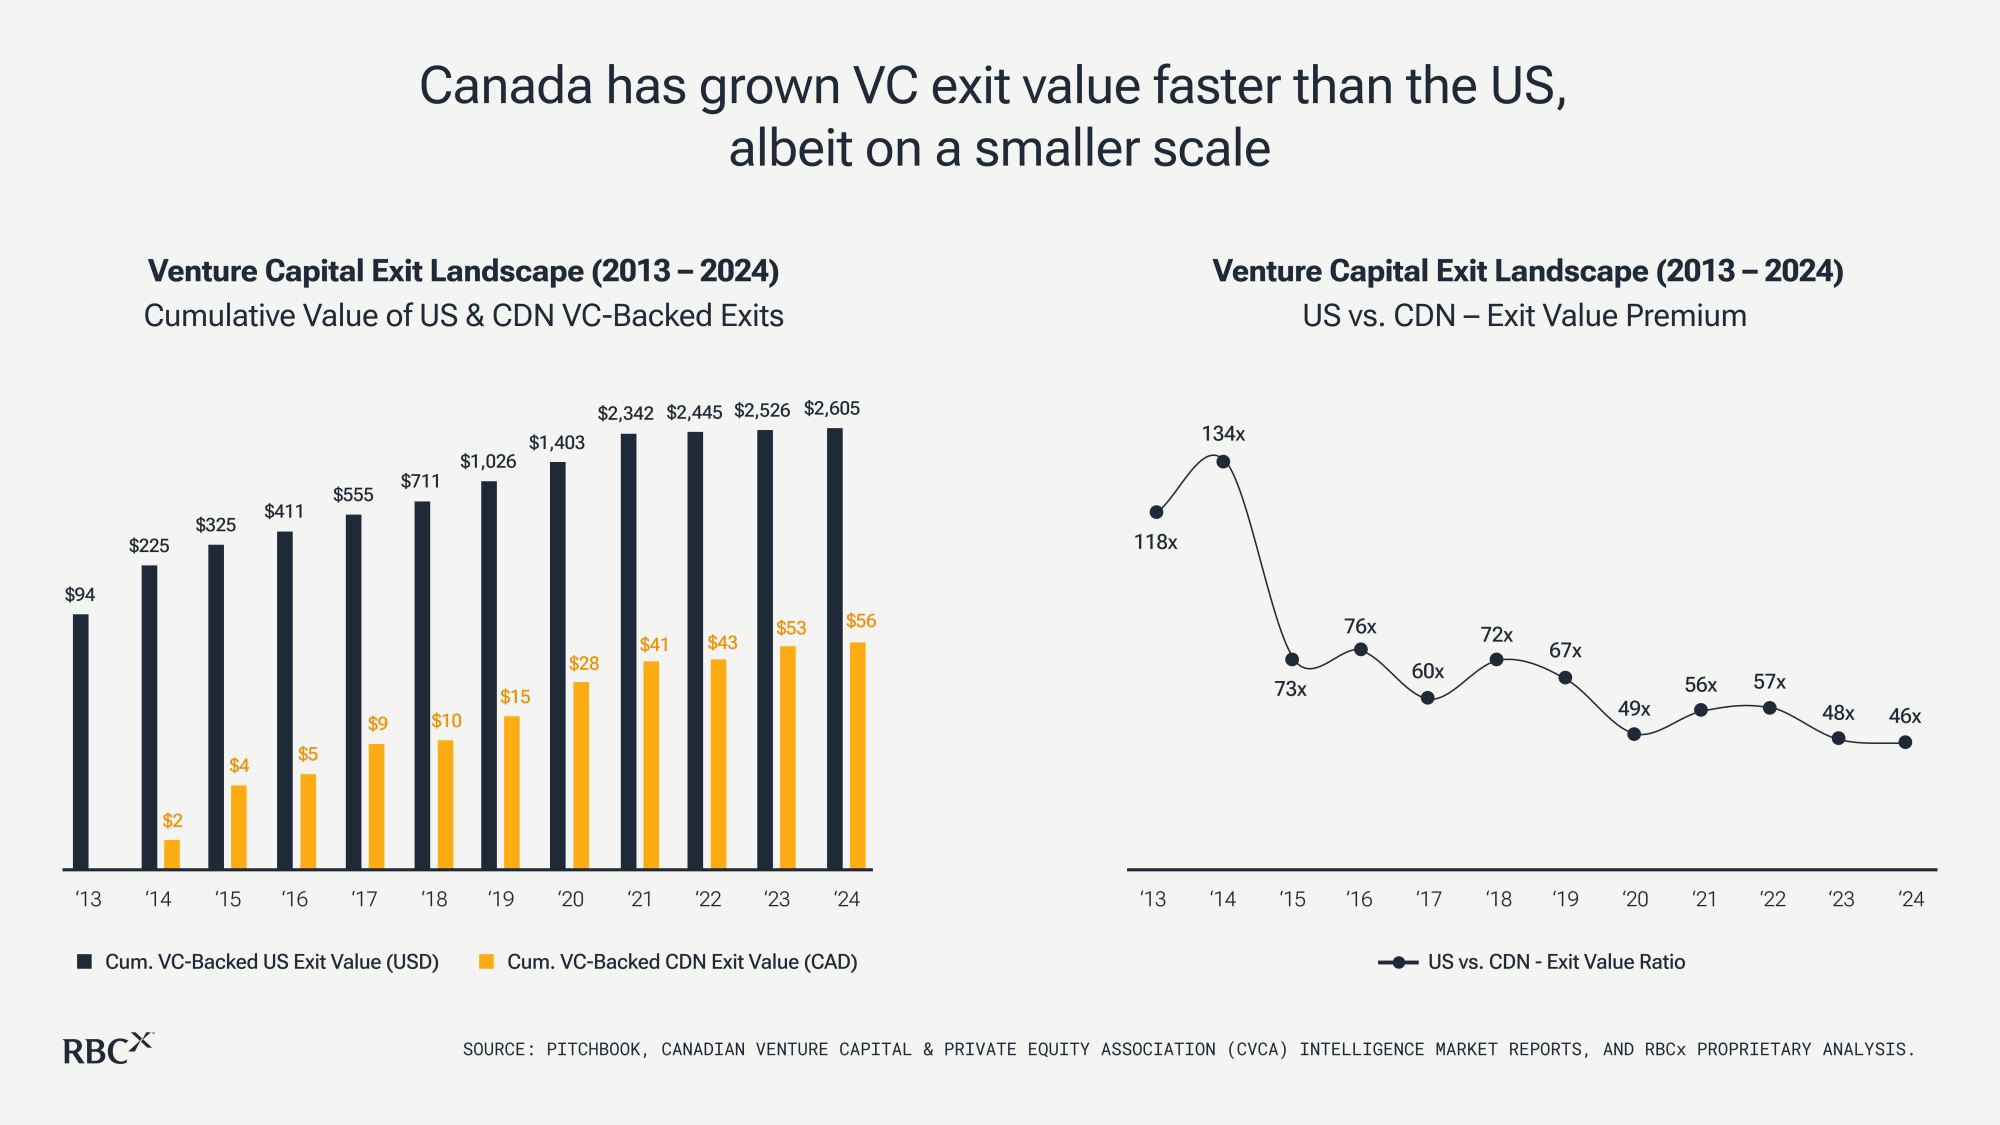
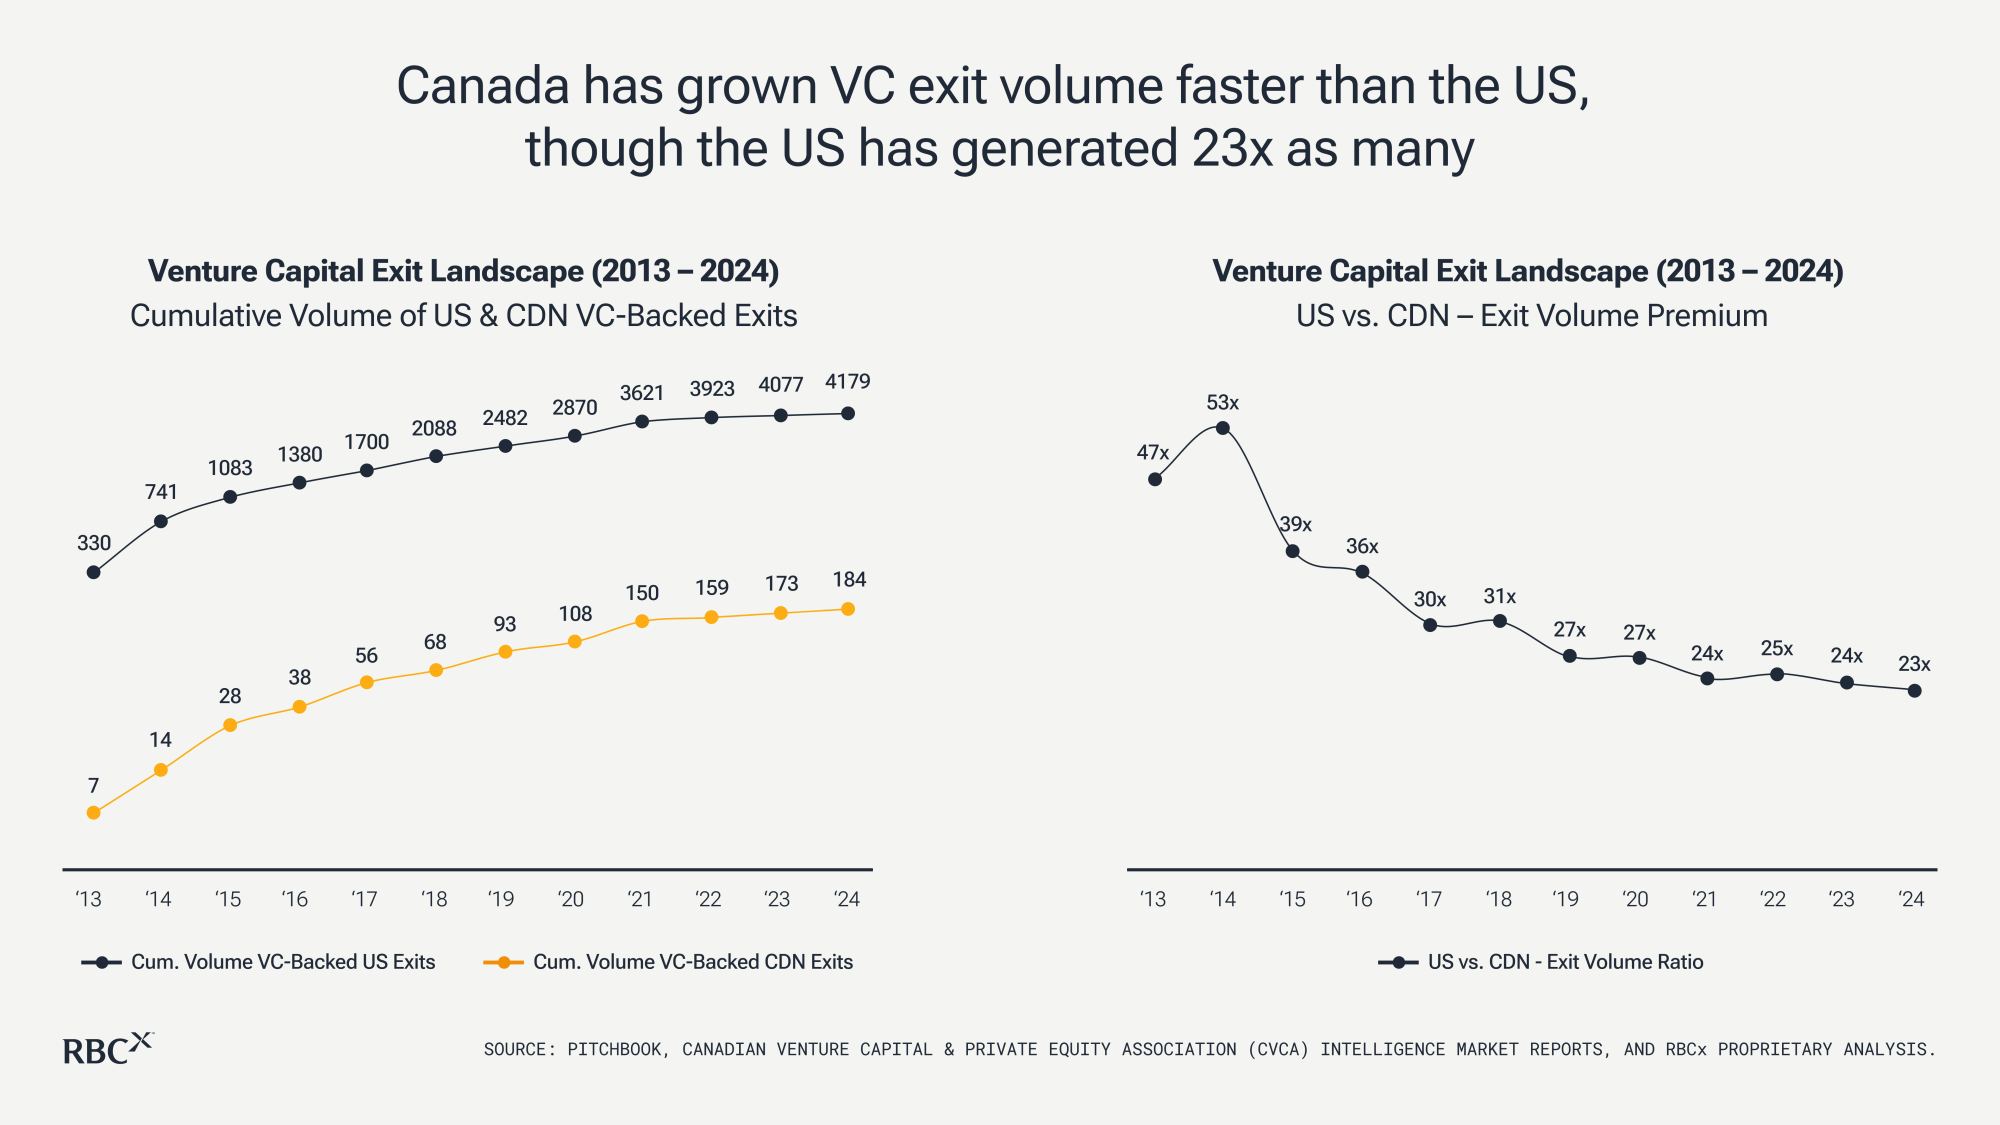
While the US venture ecosystem is more mature and operates on a much larger scale than its Canadian counterpart, there are signs we are on the right track. As the following two graphs indicate, over the past decade, the total exit value and volume of our venture ecosystem has actually grown faster than our US peers, albeit on a much smaller scale.
Over the past decade, the US VC ecosystem produced USD $2.6 trillion in exit value, which is 46 times greater than Canada’s $56 billion in exit value. This is a big improvement from its peak in 2014, when the US cumulative exit value was 134 times Canada’s exit value. Today, the ratio is its lowest on record which is a positive sign for our ecosystem.
When the lens shifts to exit volume comparison, a similar pattern emerges. In 2014, the cumulative US exits peaked at 53 times more exits than Canada, followed by a steep decline the next year and downward trend ever since. Over the past decade, the US VC ecosystem produced 4,179 exits (over USD $10 million) which is 23 times greater than Canada’s 184 exits (over CAD $10 million).
Adjusting Canadian venture for scale
Canadian venture is tracking well in exit value and volume, but US companies have historically exited for noticeably larger values. From that perspective, there are two critical implications for Canadian investors.
- The importance of having discipline on entry price and valuation; and
- The importance of prioritizing capital efficiency
Discipline on entry price and valuation
As the old adage goes, “as an investor, the only thing you can control is entry price.”
The median US exit value over the past decade was USD $141 million compared to Canada’s median of CAD $93 million. A couple examples using the median values can help explain why Canadian investors need to invest early and stay disciplined on entry price.
Example: An investor bought 10 per cent of a company for a $2 million investment at a $20 million post-money valuation and incurred no dilution through to exit. Based on the US median exit value of $140 million, this would result in $14 million in proceeds and a 7x return for a US company exiting at their median exit value. This compares to $9.3 million in proceeds and a 4.6x return for a Canadian company exiting at our median exit value of $93 million. Not surprisingly, with a larger US exit value, the US company produced a stronger return.
But what if the Canadian post-money valuation was $12 million, not $20 million, from the investor focused on investing earlier and remaining disciplined on valuation? All else remaining the same, that $93 million dollar exit would now generate nearly $16 million (versus $9.3 million) in proceeds and an 8x return – which is higher than the 7x in the US scenario. This is why it is paramount for Canadian investors to invest early and stay disciplined on entry price.
Prioritizing capital efficiency
Median US exit values are typically two times the size of Canada (when you compare the CAD $93 million median Canadian exit value with the USD $141 million US exit value). Theoretically, this means US companies can ingest two times the amount of equity capital while still achieving the same capital efficiency as Canadian companies on exit. This exemplifies why Canada and our ecosystem can’t simply mimic the company capitalization playbook of our US peers, as that would directly impact our companies’ ability to produce strong relative returns for Canadian venture and, as a result, produce less efficient exits. Capital efficiency must remain a priority in Canadian venture.
Fundraising in Canada keeps pace with US
Between 2013 and 2023, based on RBCx data, Canada raised $34.1 billion across 255 VC funds, whereas the US raised USD $888 billion across 8,990 VC funds. Although the US allocated a much larger amount of capital than Canada, we allocated capital at a similar relative pace to the US since 2019 (graph on left). The ratio of cumulative US capital raised versus Canadian capital raised in 2013 is identical to that of 2023––another healthy sign for our venture ecosystem.

Bringing it all together & looking ahead for Canadian venture
Our analysis covered the past decade of Canadian venture through the lens of capital exited, as well as capital allocated. Here, we bring both datasets together to create a new proprietary metric that we call the Cumulative Exit Value to Capital Fundraised Ratio. This efficiency metric assesses the overall health of our Canadian VC ecosystem.
The ratio calculates how many dollars “out” generated (capital exited) on a cumulative basis compared to how many dollars “in” generated (capital allocated) over the past decade. A higher ratio would imply our ecosystem has had a healthy amount of liquidity relative to the amount of capital allocated to the asset class over the past decade. A lower ratio (<1.0x) would denote that our ecosystem has not exited more capital than what we allocated over the past decade.
The graph below shows the Cumulative Exit Value to Capital Fundraised Ratio for both the US and Canada venture ecosystems.
US Cumulative Exit Value to Capital Fundraised Ratio
In 2013, the US venture ecosystem exited 4.2x the amount of capital they allocated in that year, which was their decade peak. As allocators and investors poured more capital into the asset class in the years that followed, their ratio bottomed in 2018 (2.8x), which was then followed by a surge until 2021 (3.8x) as VC had its record liquidity years. Given that IPO markets have been primarily risk-off since 2022, their ratio lowered back down to 2.8x. Overall, over the past decade and based on our data, the US market appears to have gotten more inefficient, decreasing their ratio from 4.2x to 2.8x.
Canadian Cumulative Exit Value to Capital Fundraised Ratio
The story is quite different than the US. In 2013, Canada’s ratio of 0.9x implies that we generated 90 cents in exit value for every $1 allocated to the asset class. Following trends similar to the US, we bottomed again in 2018 (1.0x) and peaked during the bull run of 2021 (1.7x). Given 2023 was a strong relative year for exits in Canadian VC, our ratio only slightly dropped from our peak to 1.6x. As a result, our Canadian ecosystem has actually gotten more efficient over the past decade, increasing our ratio from 0.9x to 1.6x.
However, it’s paramount to note that in 2023, an absolute gap remains between the US (2.8x) and Canada (1.6x) which cannot be ignored. Canada has a large cohort of late-stage, private companies who were previously funded from the original Venture Capital Action Plan in 2013 and will be primed to exit over this next decade. RBCx will continue to track the ratio between Canada and the US. It is imperative that Canadian venture works to increase our ratio and drive towards shrinking the gap with the US.
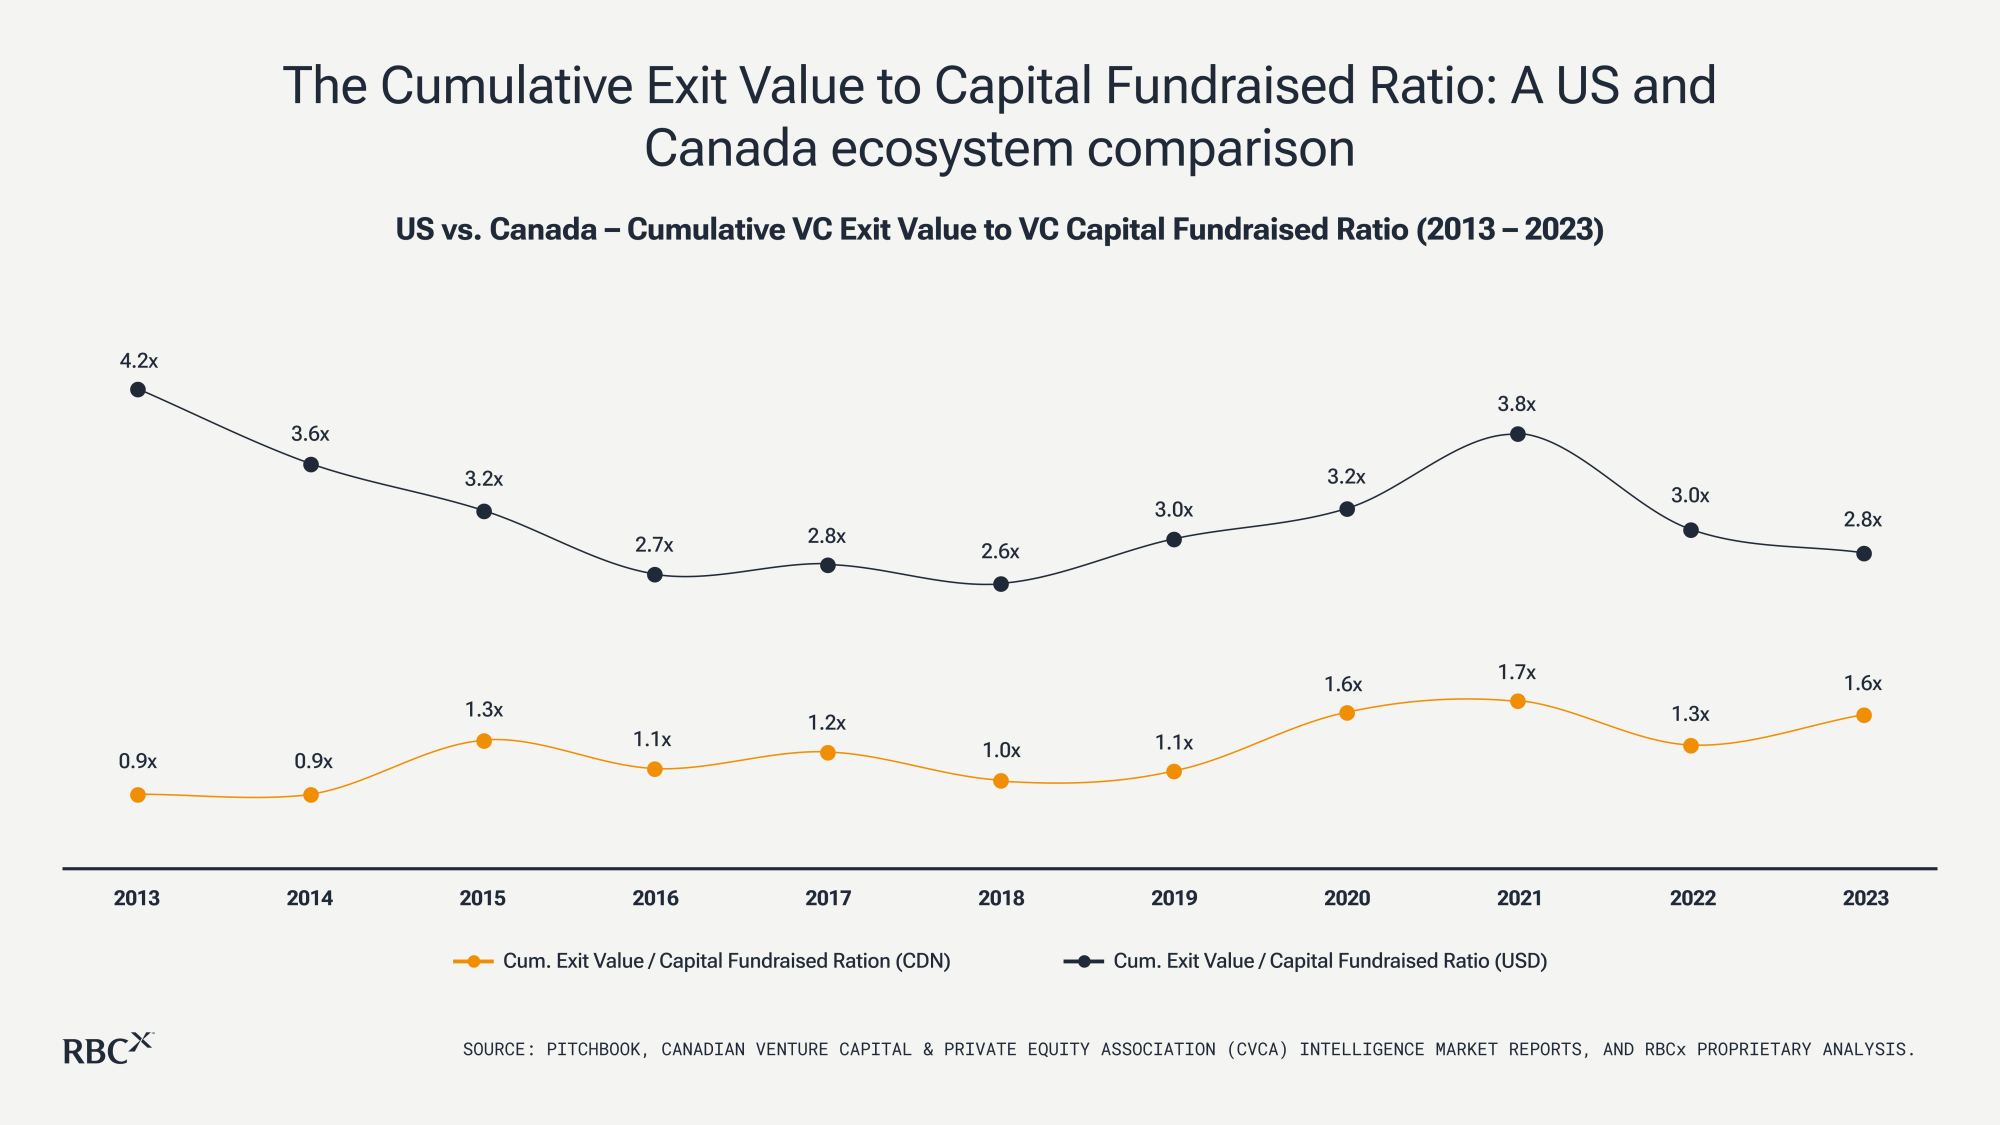
Looking ahead, the Cumulative Exit Value to Capital Fundraised Ratio allows us to benchmark comparative ecosystem efficiency between both Canada and the US VC market.
Canada has the talent, technology, companies, and capital to build through this next market cycle from a position of strength. We remain optimistic about the foundations of our Canadian venture ecosystem, our comparative position relative to the US market, and the exciting cohort of late-stage private companies that will strengthen Canada’s global technology reputation in the years ahead.
RBCx offers support to startups in all stages of growth, backing some of Canada’s most daring tech companies and idea generators. We turn our experience, networks, and capital into your competitive advantage to help you scale and make a meaningful impact on the world. Speak with a RBCx Advisor to learn more about how we can help your business grow.
RBCx’s methodology for determining Canada’s Top VC-Backed Exits
The following five criteria where required to be met for an exit to be included in this report:
- Founded in Canada
- Has raised at least one form of venture capital financing from a venture capital investor. Companies who raised exclusively from angel investors, family offices, crowdfunding sources, or other non-traditional or non-equity forms of financing do not qualify
- The company exit occurred betweenJanuary 1, 2013 and August 1, 2024
- The company exited for a value equal to or greater than $10 million
- The proxy in determining a company’s exit value was determined through one of the following three transaction types:
- Initial Public Offering (“IPO”)
- Merger or Acquisition (“M&A”)
- Majority Buyout
